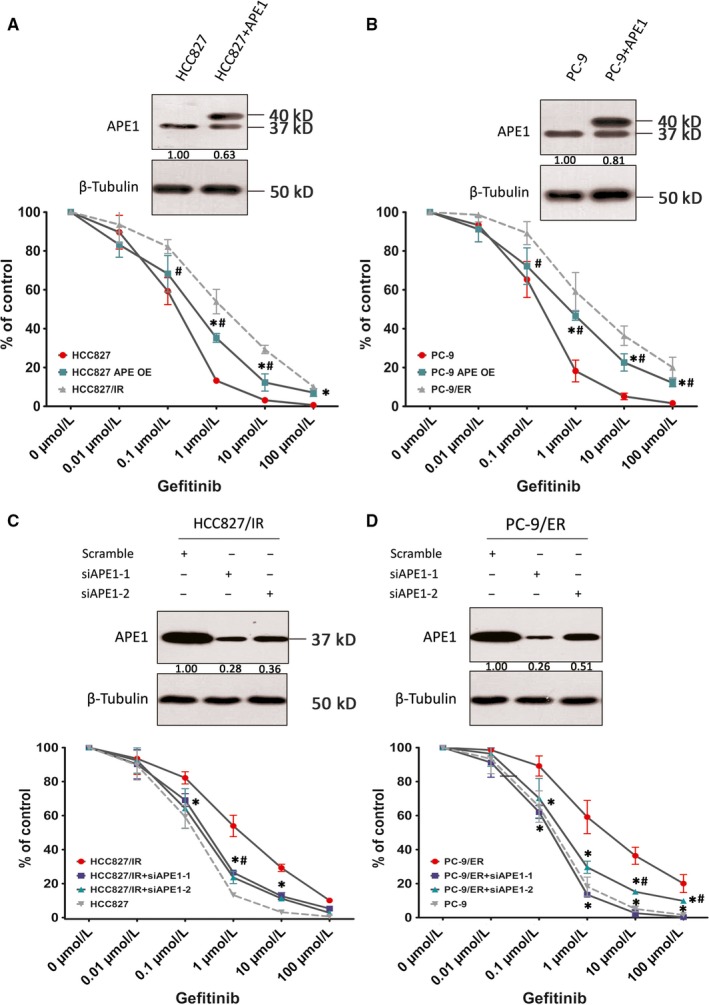
Figure 3.

Manipulations of APE1 regulate cellular responses to EGFR‐TKIs. APE1 was overexpressed in HCC827 and PC‐9 cell lines via lentiviral particles (A and B) and knocked down in HCC827/IR and PC‐9/ER via two different siRNA sequences specific for the Ape1 gene (C and D). APE1 expression levels were then analyzed by Western blot (shown in the upper panel of each subfigure) and treated with increasing concentrations of gefitinib to determine the cytotoxicity of EGFR‐TKI by CCK8 assay. To exclude the impact of APE1 manipulation on cell growth, various gefitinib dose treatments of each group have been normalized to the readout of 0 uM (DMSO only) treatment. Mean values of at least three individual experimental repeats are shown as the mean ± SD. In A and B, statistically significant differences of the APE1 overexpression group when compared with empty particle‐infected parental sensitive cells (indicated by *) or resistant cells (indicated by #) at the same treatment dose/time (P < 0.01) are shown. In C and D, statistically significant differences of APE1 knockdown group when compared with empty particle‐infected resistant cells (indicated by *) or parental sensitive cells (indicated by #) at the same treatment dose/time are shown (P < 0.01)
