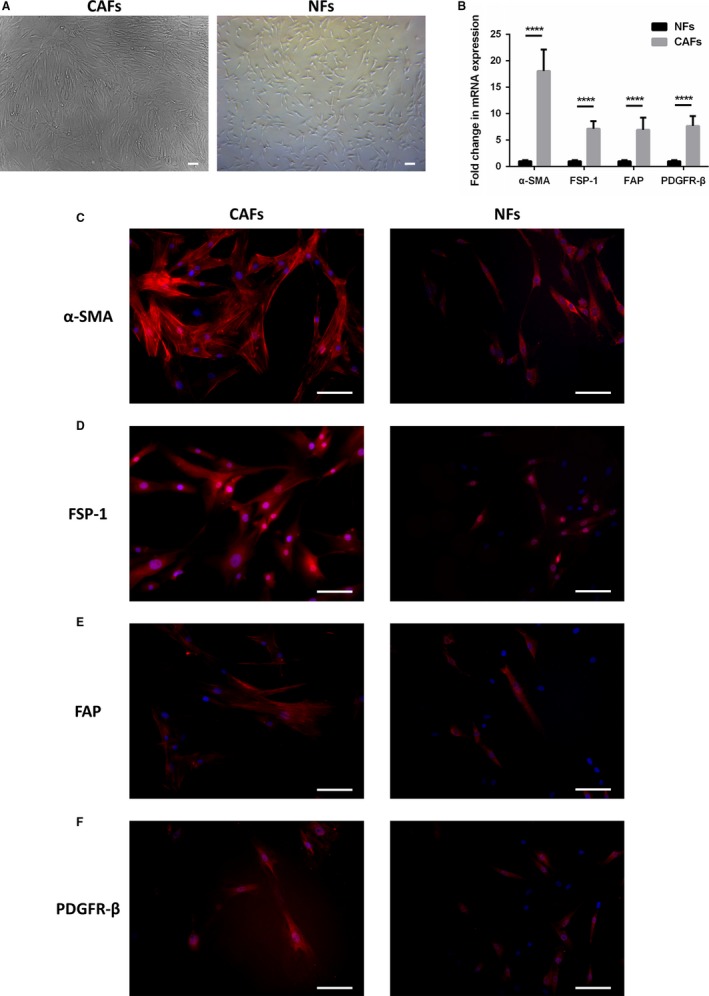
Figure 1.

Generation of CAFs of human ICC. A, Isolated CAFs had irregular spindle‐shaped or stellate‐like morphology and formed the structure of network progressively, while isolated NFs were identified by the regular short spindle shape (scale bar: 100 μm). B, Relative mRNA level of α‐SMA, FSP‐1, FAP, and PDGFR‐β, measured by real‐time PCR in isolated CAFs and NFs (P < 0.0001 versus expression in NFs). Bars represent the mean ± SD of triplicate experiments. Representative images of immunofluorescence staining of cultured CAFs and NFs with α‐SMA (C), FSP‐1 (D), FAP (E), and PDGFR‐β (F) antibodies (red) and counterstained with DAPI (blue; scale bar: 100 μm)
