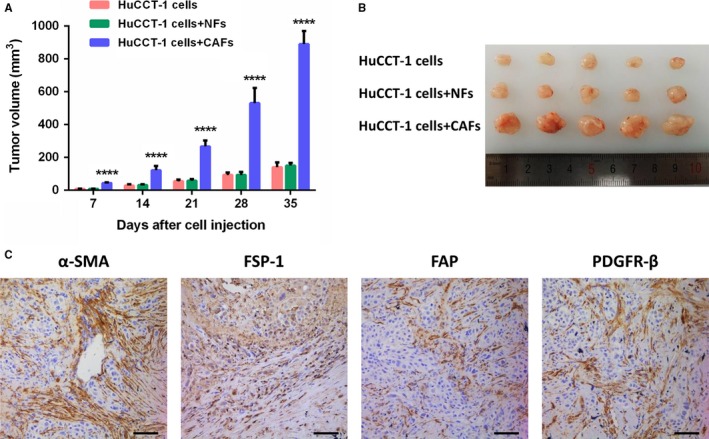
Figure 4.

CAFs promote cholangiocarcinoma tumor growth in vivo. A, Tumor volume of mice bearing cholangiocarcinoma cells (HuCCT‐1), cholangiocarcinoma cells plus NFs, and cholangiocarcinoma cells plus CAFs (P < 0.0001 versus tumor of cholangiocarcinoma cells and cholangiocarcinoma cells plus NFs). Bars represent the mean ± SD. B, Representative image of tumor from each group at sacrifice. C, Representative immunohistochemical stainings for α‐SMA, FSP‐1, FAP, and PDGFR‐β of mice tumor sections (scale bar: 100 μm)
