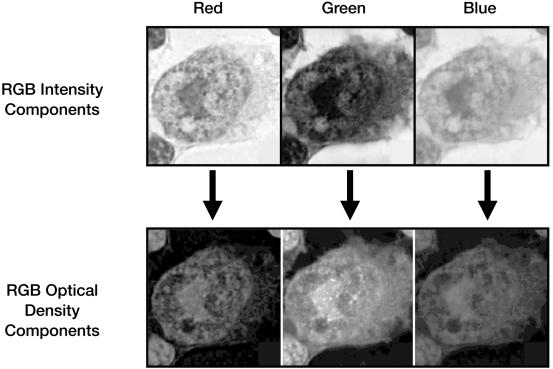
Figure 4.
Intensity values of an image vary with both the incident light intensity and the optical density of the specimen. To control for variations in incident intensity, the RGB component matrixes of an image are converted to optical density matrixes. These matrixes are used for all subsequent cytometric calculations.

