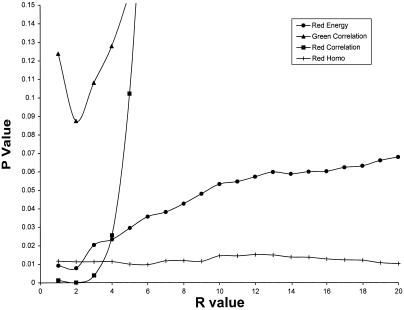
Figure 9.
The statistical significance of differences between Markov descriptors of mantle cell nuclear texture and small cell lymphoma nuclear texture varies as a function of r, the radius with which the gray-level co-occurrence matrix was compiled. The P values of a Student t test are displayed. The r values are expressed as horizontal pixel distances. In the key, “Homo” indicates homogeneity.

