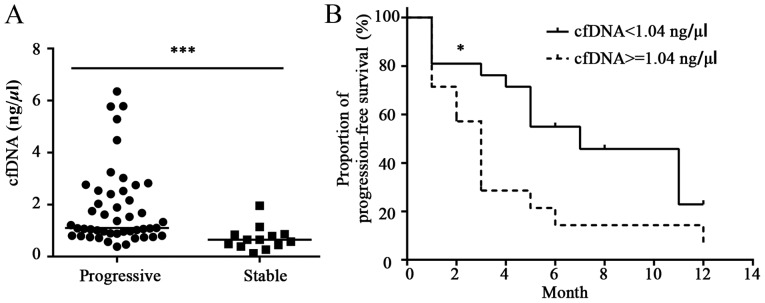
Figure 4.
The cfDNA concentration in NSCLC patients with stable vs. progressive disease. (A) Comparison of serum cfDNA concentrations in NSCLC patients with progressive or stable disease. (B) Kaplan-Meier curves of PFS based on serum cfDNA levels in NSCLC patients. P-values were calculated by using the Mann-Whitney test. *P<0.05 and ***P<0.001 indicate statistical significance. cfDNA, cell-free DNA; NSCLC, non-small cell lung cancer; PFS, progression-free survival.

