
Figure 2.
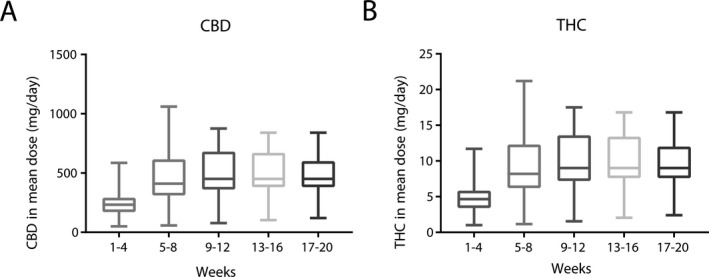
The doses of CBD (A) and THC (B) achieved for all participants during the intervention period. The Boxplots show mean values, with 25th and 75th percentiles. The whiskers denote the minimum and maximum doses.
Official websites use .gov
A
.gov website belongs to an official
government organization in the United States.
Secure .gov websites use HTTPS
A lock (
) or https:// means you've safely
connected to the .gov website. Share sensitive
information only on official, secure websites.
The doses of CBD (A) and THC (B) achieved for all participants during the intervention period. The Boxplots show mean values, with 25th and 75th percentiles. The whiskers denote the minimum and maximum doses.