
Figure 5.
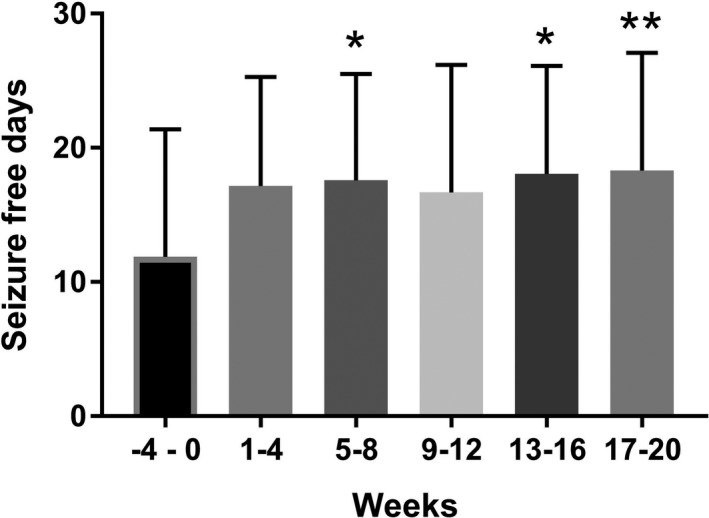
Mean number of seizure free days in each 4‐week period comparing pre‐intervention (week −4–0) with each 4 week block of intervention period (weeks 1–20). The mean (bar) and standard deviation (tail) are shown below for all 19 participants. *P < 0.05; **P < 0.01