
Figure 1.
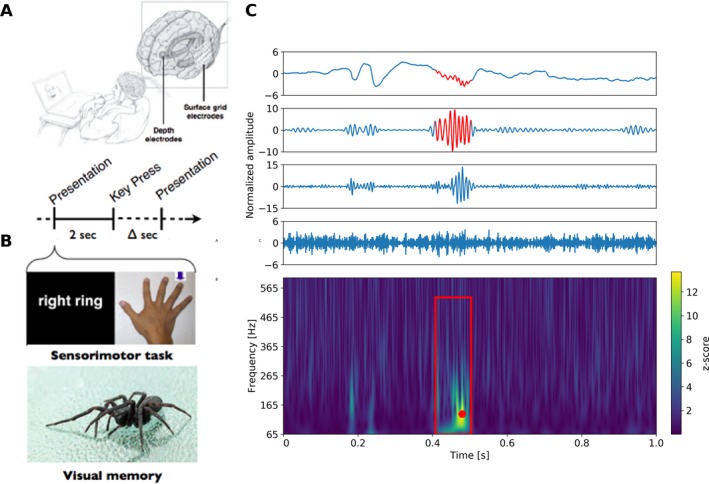
Task induced physiological high frequency oscillations (physHFO). (A) Schematic of patient performing laptop cognitive and motor tasks to induce physHFO associated with a physiological process. (B) Laptop computer presents finger name or picture of finger to move (right ring finger). The subject then toggles a keypad with the appropriate finger. Similarly, in the visual memory task the images are presented on a laptop for encoding and subsequent recall. Images are shuffled and mixed with foils during the recall task. (C) (Top) The upper panels show normalized raw data and band filtered data recorded (raw signal, high‐gamma band, ripple band, fast ripple band – top to bottom). Red segment identifies automated HFO detection. (Bottom) Power spectrogram with Hilbert transform of 1 Hz filtered bands and z‐scored signal. Significant HFO power increases (z‐score >3.0) longer than three oscillations at frequency corresponding to the point with highest z‐score shown as the red dot in the spectrogram. Red box identifies the bounding box of an automated HFO detection representing its spectral and temporal onsets and offsets.