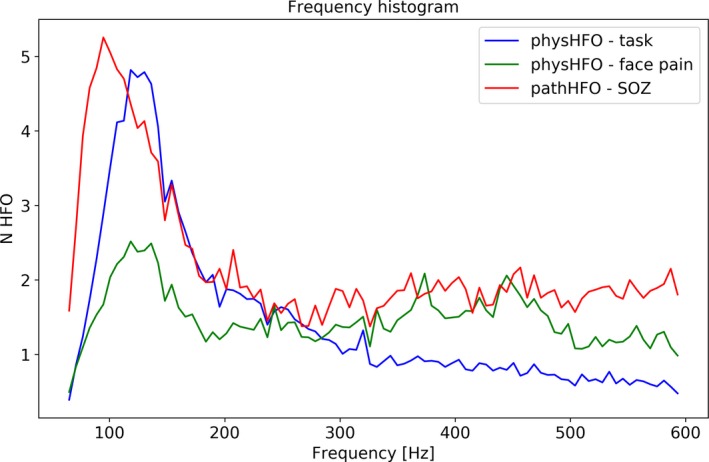
Figure 3.

Distribution (histogram) of Physiological and Pathological High Frequency Oscillations (physHFO & pathHFO) Frequencies. The distribution of physHFO (blue = task induced outside seizure onset zone (nonSOZ), green = facial pain patients without history of seizures) and pathHFO (red = detected events inside the seizure onset zone (SOZ)) aggregated across patients with excellent outcome (ILAE = 1). The histograms of physHFO and pathHFO show distributions with a peak, characteristic or dominant oscillation frequency, in the high gamma to ripple frequency range.
