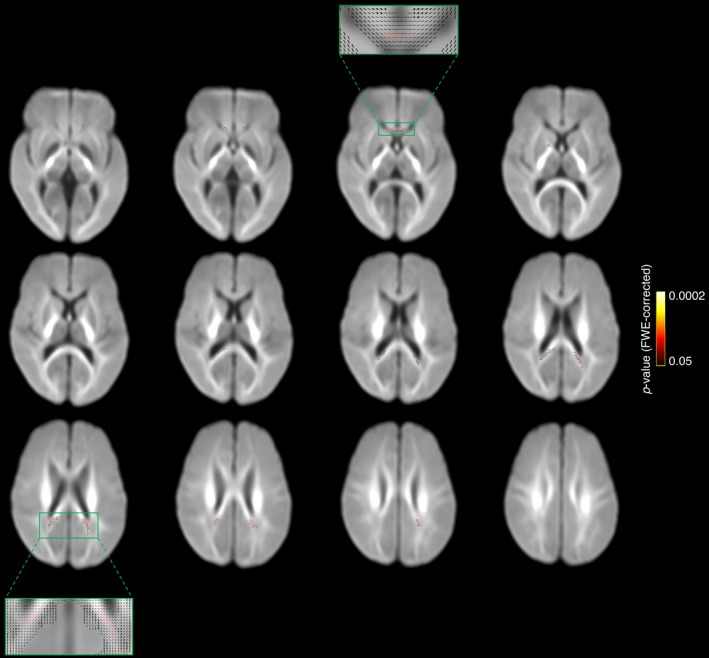
Figure 2.

Results of the whole brain white matter microstructure analysis (fixel‐based analysis) at 11 years of age. The fiber populations that had a lower fiber cross‐section in the caffeine group compared with the placebo group at P < 0.05, family‐wise error rate (FWE) corrected, are shown in red‐yellow and overlaid on the study‐specific fiber‐orientation distribution template. These fibers were located mostly in the isthmus or splenium of the corpus callosum, as well as the genu of the corpus callosum, and a very small number were in the left anterior limb of the internal capsule. We have presented every second axial slice (in the range of the significant results). We have zoomed in on representative slices to show the fiber orientation distribution in these slices, which shows that the significant results were located in single fiber regions. These results are based on an analysis with n = 116 children (62 caffeine, 54 placebo), that is, one less than the total n = 117. One child was excluded from this analysis as they did not complete the b = 3000 sec/mm2 diffusion sequence.
