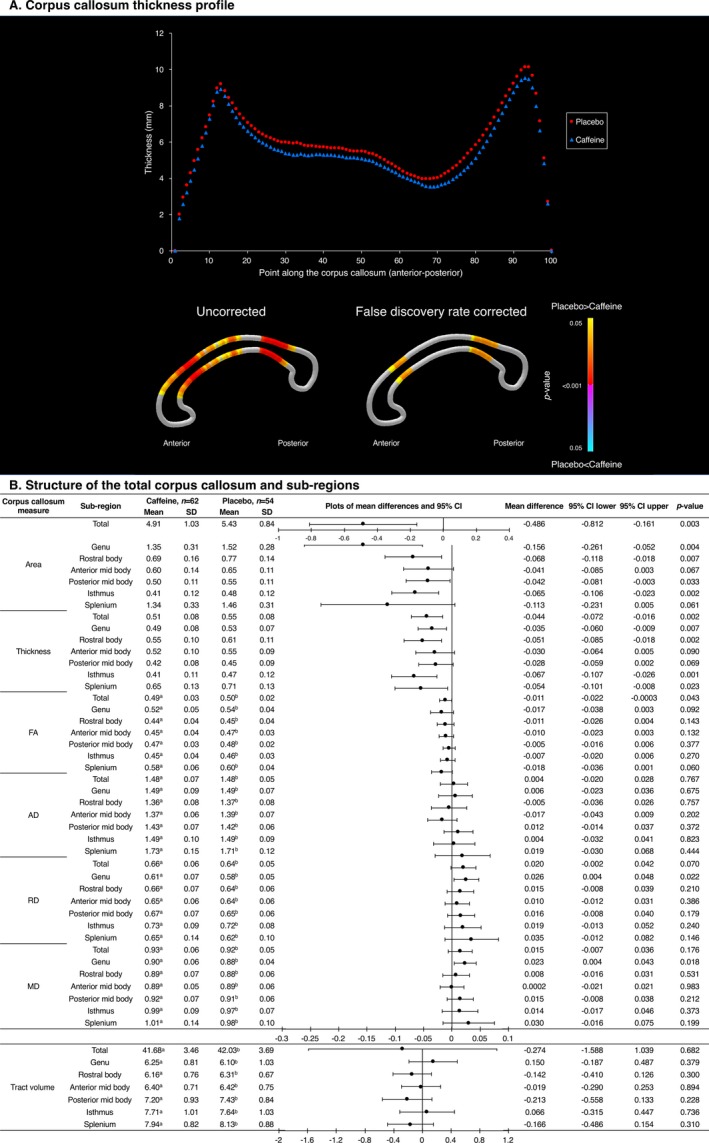
Figure 4.

Structure of the corpus callosum, contrasted between treatment groups at 11 years of age, based on the corpus callosum segmentation. (A) Top: Mean thickness at each of 100 points along the corpus callosum; bottom: results of t‐tests comparing thickness at each point between treatment groups, with colors indicating P‐values. (B) Data from the total corpus callosum and six sub‐regions. Mean differences are from separate linear regression models for each outcome, adjusted for age and sex of the child. The plots are visual representations of the mean differences and 95% confidence intervals (CI). Units are cm2 for area, cm for thickness and ×10−3 mm2/sec for diffusivities. SD = standard deviation. The analyses are based on a total n = 116 (62 caffeine, 54 placebo) children, that is, one less than the total n = 117 children. One child from the caffeine group was excluded from all the corpus callosum analyses because they had artefact on their structural image and because they did not have b = 3000 sec/mm2 diffusion images acquired. Additional children were excluded from the corpus callosum tractography analysis, because their diffusion images had artefact or structural abnormalities which affected that particular analysis: a n = 2 missing; b n = 5 missing.
