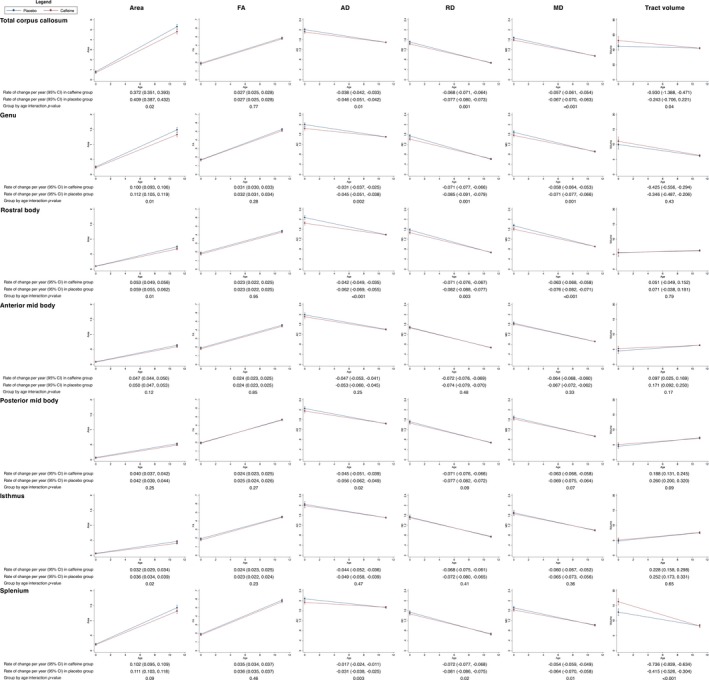
Figure 6.

Rates of change in the structure of the total corpus callosum and sub‐regions from term‐equivalent age to 11 years of age, contrasted between treatment groups. Results are from separate mixed effects models for each corpus callosum region and parameter (area, thickness, diffusion value or tract volume), adjusted for sex of the child. The plots show the estimated means and 95% confidence intervals (CI) per group for each time point and the rate of change between time points from the mixed models. The y‐axes show the parameters (area, thickness, diffusion value or tract volume) and the x‐axes show age. Units are cm for thickness, cm2 for area, cm3 for volumes, ×10−3 mm2/sec for diffusivities and years for age. The results are based on the total number of children who had usable MRI data at either term‐equivalent age or 11 years of age; for the area measures, n = 144 (28 with term‐equivalent data plus 116 with 11‐year data); for the total tract diffusion and volume measures, n = 129 (20 plus 109); for the genu diffusion and volume measures, n = 137 (28 plus 109); for the rostral body diffusion and volume measures, n = 135 (26 plus 109); for the anterior mid body diffusion and volume measures, n = 133 (24 plus 109); for the posterior mid body diffusion and volume measures, n = 134 (25 plus 109); for the isthmus diffusion and volume measures, n = 134 (25 plus 109); for the splenium diffusion and volume measures, n = 137 (28 plus 109). FA, fractional anisotropy; AD, axial diffusivity; RD, radial diffusivity; MD, mean diffusivity.
