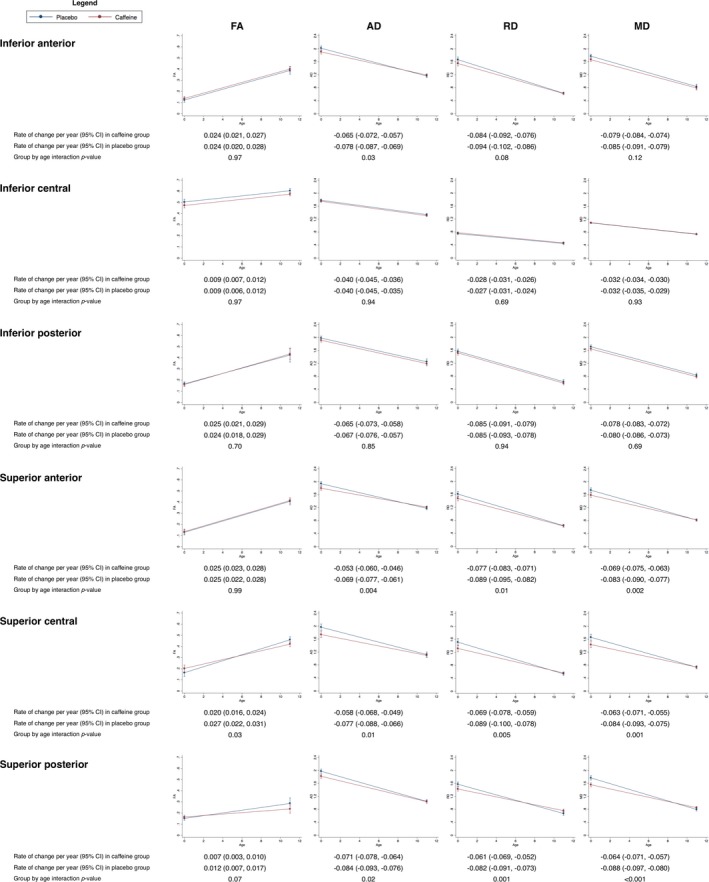
Figure 7.

Rates of change in diffusion values in regions of interest from term‐equivalent age to 11 years of age, contrasted between treatment groups. Results are from separate mixed effects models for each region and parameter (FA, AD, RD, and MD), adjusted for sex of the child. The plots show the estimated means and 95% confidence intervals (CI) per group for each time point and the rate of change between time points from the mixed models. The y‐axes show the parameters (FA, AD, RD, MD) and the x‐axes show age. Results are combined across brain hemispheres as there was negligible evidence that results differed by hemisphere. Units are ×10−3 mm2/sec for diffusivities and years for age. The regions of interest were drawn on diffusion images from 28 infants at term‐equivalent age.7 Of those 28 infants, 19 had MRI at 11 years of age, and matching regions of interest were drawn on the 11‐year diffusion images of these 19 children. These longitudinal analysis results are based on the 28 infants with usable term‐equivalent data and the 19 children with usable 11‐year data. FA, fractional anisotropy; AD, axial diffusivity, RD, radial diffusivity; MD, mean diffusivity.
