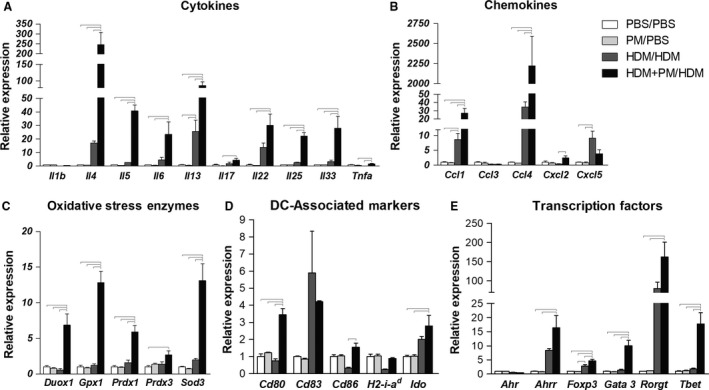
Figure 7.

Pulmonary gene expression profiles of cytokines (A), chemokines (B), oxidative stress enzymes (C), dendritic cell (DC)‐associated molecules (D), and transcription factors (E). Gene expression is shown as relative expression to GAPDH or Eef1a1 housekeeping genes. Abbreviations: Il = interleukin, Tnfa = tumor necrosis factor alpha, Ccl = C‐C motif chemokine ligand, Cxcl = C‐X‐C motif chemokine ligand, Duox = dual oxidase, Gpx = glutathione peroxidase, Prdx = peroxiredoxin, Sod = superoxide dismutase, Cd = cluster of differentiation, H2‐a‐id = major histocompatibility complex II, beta‐chain, Ido = indoleamine 2,3‐dioxygenase, Ahr = aryl hydrocarbon receptor, Ahrr = aryl hydrocarbon receptor repressor, Foxp3 = forkhead box P3, Gata3 = GATA binding protein 3, Rorgt = retinoid‐related orphan receptor gamma t, Tbet = T‐box transcription factor, Th1‐associated. Data are presented as mean ± SEM (n = 3–4/group). Bars indicate a significant difference of P < 0.05 between groups.
