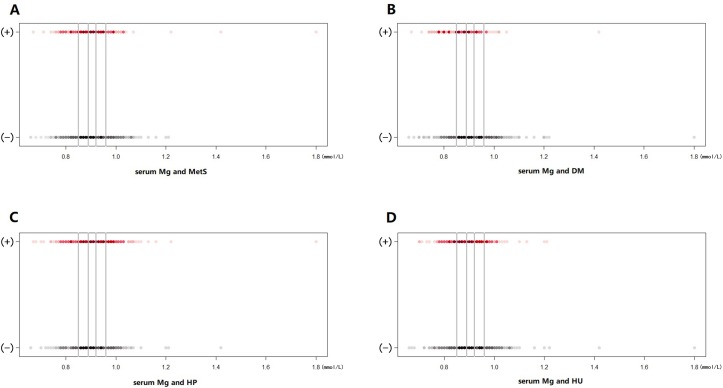
Figure 1.
Prevalence of metabolic syndrome (MetS) (A), diabetes mellitus (DM) (B), hypertension (HP) (C) and hyperuricaemia (HU) (D) in each quintile of serum Mg in patients with radiographic knee OA. The figures above present the prevalence of MetS (A), DM (B), HP (C) and HU (D) among the 962 patients with OA under different quintiles of serum Mg levels. The horizontal axis denotes the serum Mg level, and the vertical axis indicates whether a subject is diagnosed with the specific disease: (+), disease; (−), no disease. The solid grey lines represent the boundaries in between the five quintiles of serum Mg levels. The red and black spots represent the prevalence of diseases and no diseases at each serum Mg level, respectively. The darker the colour of a spot, the more patients with OA there are at the corresponding concentration.

