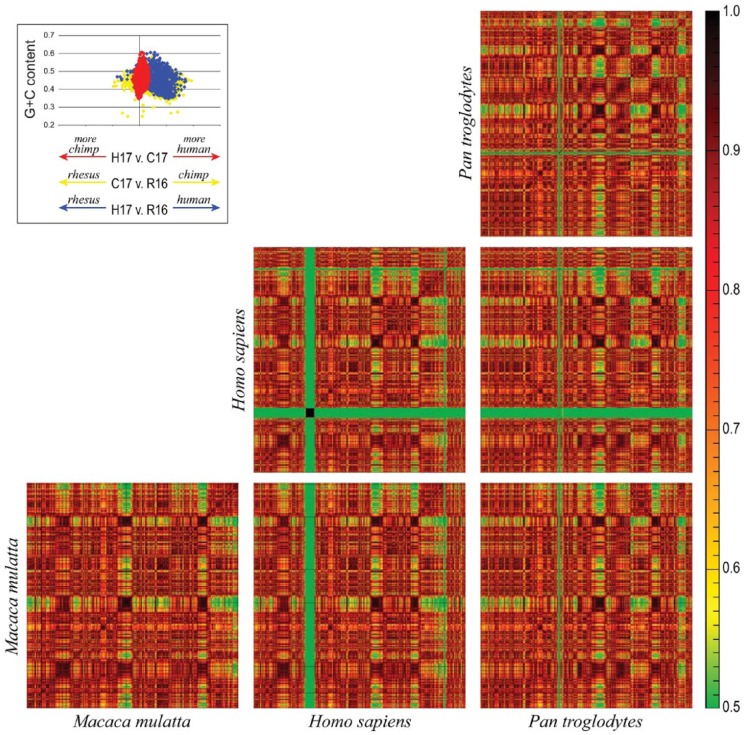
Figure 3.
Comparison of human (Homo sapiens) chromosome 17 (H17), chimpanzee (Pan troglodytes) chromosome 17 (C17), and rhesus (Macaca mulatta) chromosome 16 (R16). Sequence similarity is measured by the frequency of shared k-mers, with green signifying low similarity and red signifying high similarity. The inlay shows the divergence between H17 and C17 (red), C17 and R16 (yellow), and H17 and R16 (blue), relative to the window’s GC content. The x-axis is representative of the divergence calculated for a window relative to its GC content.

