Figure 2.

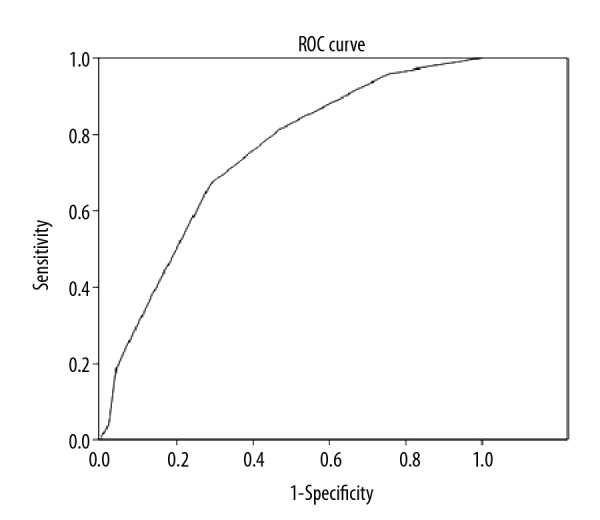
ROC analysis showed 67% sensitivity and 71% specificity for a cut-off value of 0.55 for EAT vertical (cm) (p<0.001 area under ROC curve: 0.831676).

ROC analysis showed 67% sensitivity and 71% specificity for a cut-off value of 0.55 for EAT vertical (cm) (p<0.001 area under ROC curve: 0.831676).