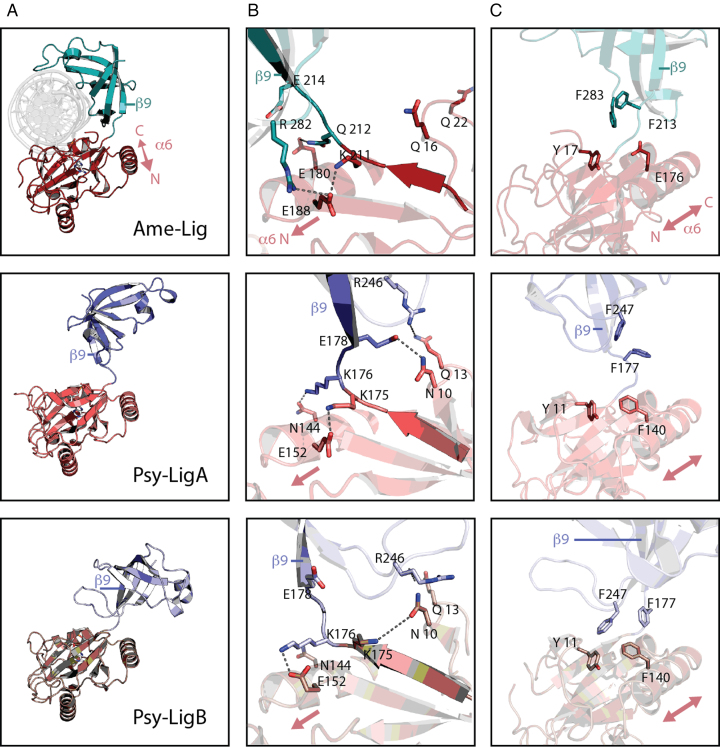
Figure 6.
Comparison of Lig E domains in DNA-bound and apo- conformations. AD-domain is shown in red, OB domain is shown in cyan/blue. Polar contacts are indicted by dashed gray lines. (A) Overall domain conformations. (B) Rearrangement of hydrogen bonding patterns between three conformations. (C) Comparison of hydrophobic interactions between three conformations.

