Figure 4.
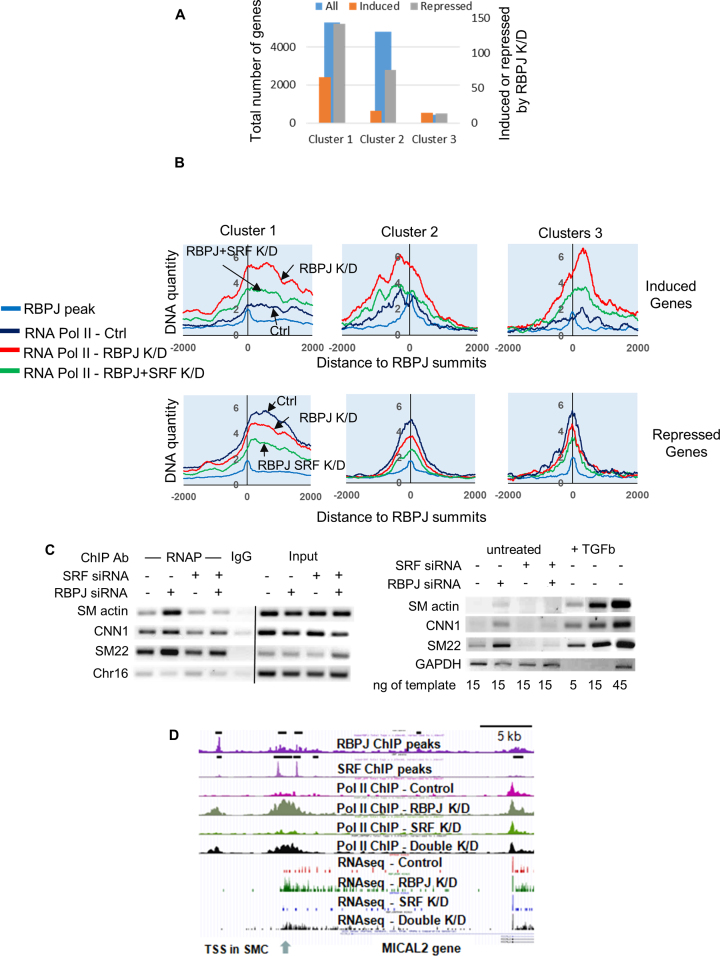
RBPJ and SRF cooperated to regulate gene expression in SMC. (A) Coordinately induced and repressed genes were categorized based upon the cluster analysis shown in Figure 2A. (B) Quantification of RNA Pol II binding centered at RBPJ summits in control, RBPJ and RBPJ/SRF double knockdown cell lines for the indicated cluster from Figure 2A. Genes induced (top) or repressed (bottom) by RBPJ knockdown were analyzed separately. (C) RNA Pol II binding to and mRNA expression of the indicated SMC-specific genes was measured by targeted ChIP and semi-quantitative RT assays, respectively, in RBPJ knockdown and RBPJ/SRF double knockdown cells. (D) UCSC browser screenshot highlighting changes in RNA Pol II binding and mRNA induction at the MICAL2 gene in RBPJ and RBPJ/SRF double knockdown Hu Ao SMC. A previously un-annotated transcription start was identified and is marked by an arrow.

