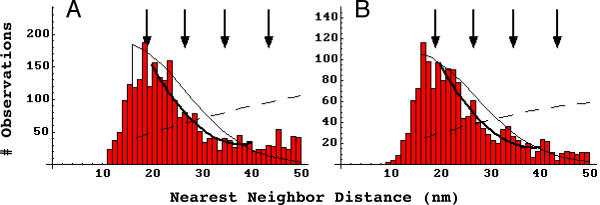
Figure 3.
Frequency histograms of experimental nearest neighbor distances. A, laminin-1 induced receptor aggregates (n = 2581, n-reduced = 1468). B, spontaneous receptor aggregates (n = 1527, n-reduced = 905). Arrows, prominent in peaks in agrin-induced receptor aggregates, do not characterize laminin-induced aggregates (A) but may be present in spontaneous aggregates (B). A compared to B, Pearson χ2 p < .0001. Dashed curves, the probability density functions for randomly distributed particles with a hindrance of 16 nm at the respective densities found. A or B compared to data, Pearson χ2 < 10-10. Solid curves – the same functions with the density terms artificially elevated to best approximate the distributions in the range 20 to 40 nm. A or B compared to data, Pearson χ2 p < 10-10. Heavy solid curves, best fit quadratics over the range 20 to 40 nm. A, 300.75 - 14.67 x + 0.19 x2, Pearson χ2 p > 0.22. B, 196.41 - 9.45 x + 0.12 x2, Pearson χ2 p < 0.02.

