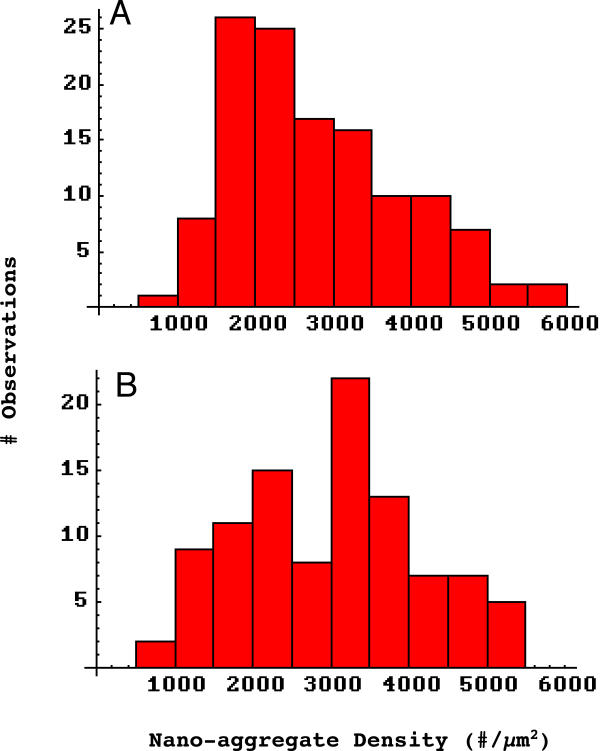
Figure 6.
Frequency histograms of nanoaggregate density. A, laminin-1 induced receptor aggregates (n = 124). B, spontaneous receptor aggregates n = 99). The latter distribution appears to be bimodal, suggesting that there may be two populations of spontaneous aggregates. A compared to B, Pearson χ2 p < .001.

