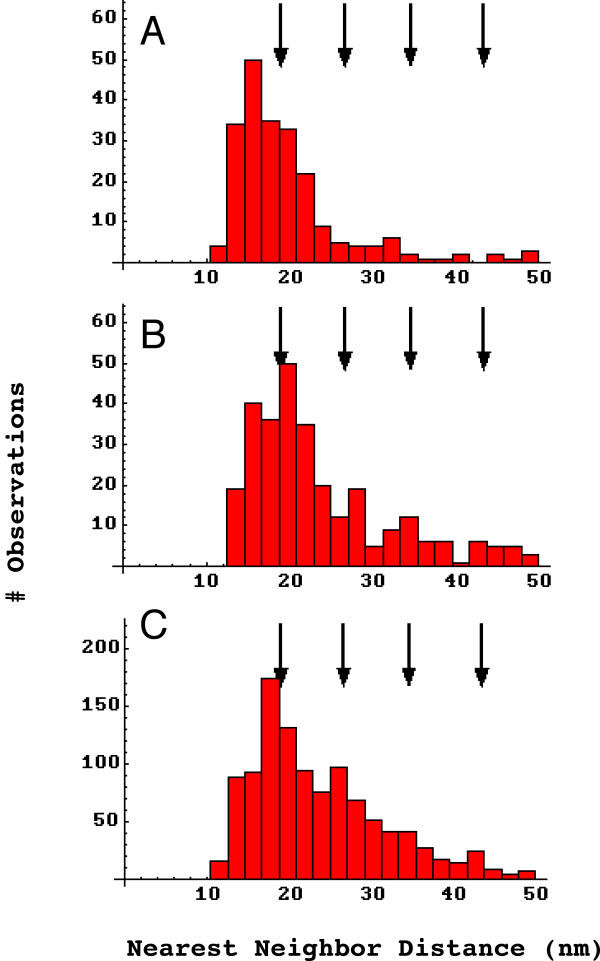
Figure 7.
Frequency histograms of experimental and simulated nearest neighbor distances. A, high density receptor aggregates (n = 218, n-reduced = 146). B, low density receptor aggregates (n = 289, n-reduced = 178). C, simulation of nearest neighbor distances assuming a hexagonal array of receptors with a spacing of 9.9 nm. Arrows, prominent in peaks in agrin-induced receptor aggregates, do not characterize high density aggregates (A) but appear to be represented in low density aggregates (B). A vs. C, Pearson χ2 < 10-10. B vs. C, Pearson χ2 > 0.13.

