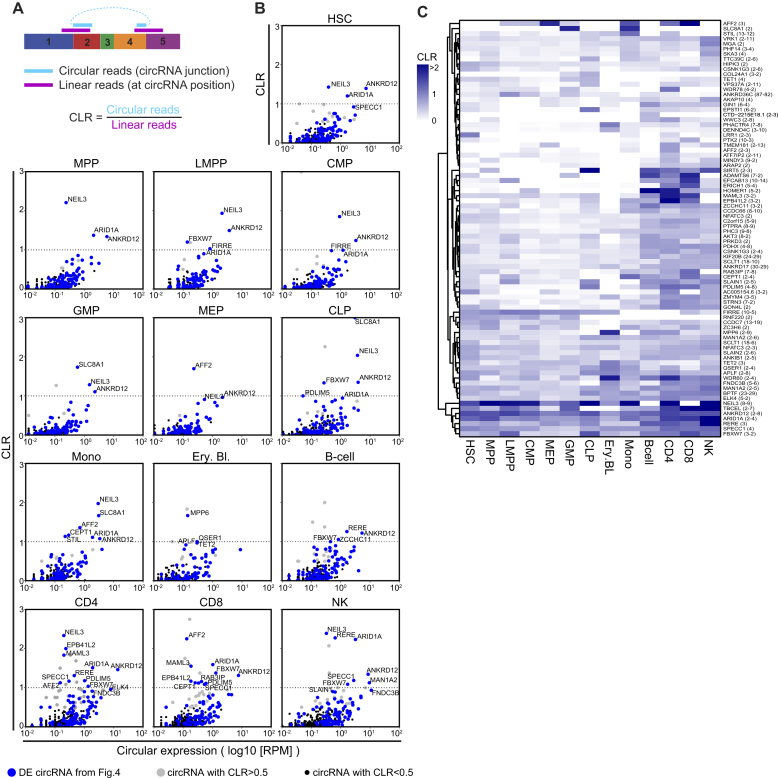
Figure 5.
CircRNA usage alters during hematopoietic differentiation. (A) Scheme showing how the circular-to-linear ratio (CLR) is computed using DCC (32). (B) CLR of circRNA from Figure 3 for each population against the number of reads of the circRNA (log10 (RPM)). CLR >1 indicates that the sample contains more transcripts for the circRNA than the corresponding linear transcript. Blue dots are the 102 differentially expressed circRNA from Figure 4, gray dots are circRNA with a CLR >0.5, and black dots are circRNA with CLR <0.5. (C) Heatmap showing the average CLR within a population, of circRNA having CLR >0.5 in at least one of the hematopoietic populations.

