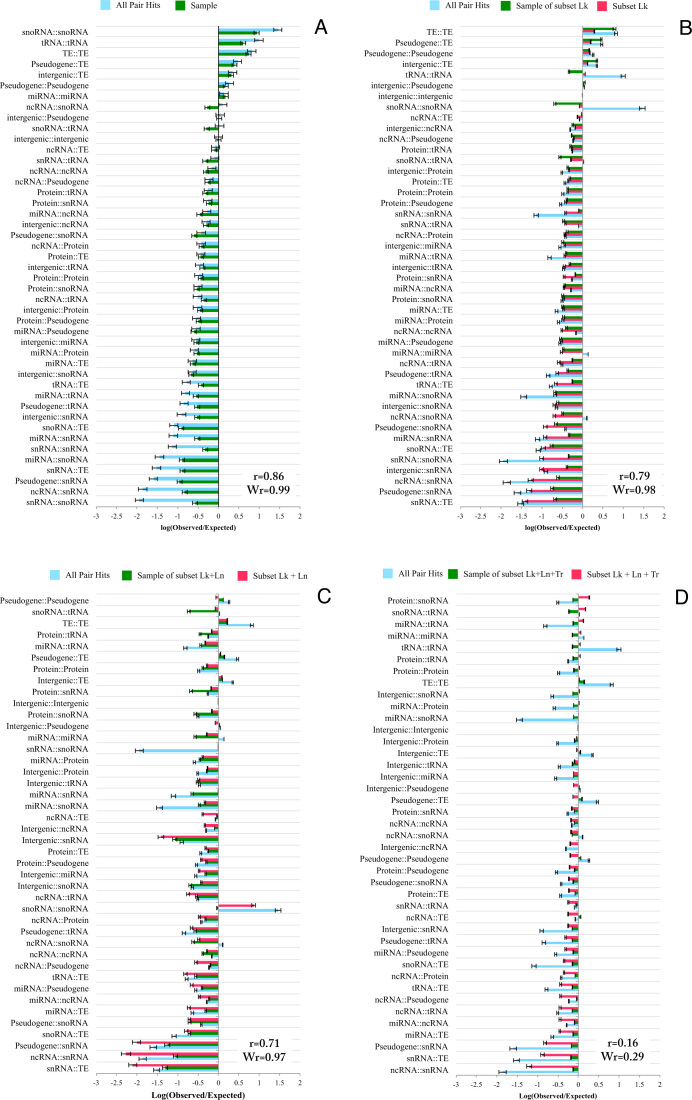
Figure 4.
Enrichment (Equations 6–10, natural log) of pair hits in genomic classes using as reference intergenic regions-intergenic region correlations and compared to its resampling. (A) All pair hits. (B) Subset Lk, pair hits with more than 10K bp distance between them. (C) Subset Lk + Ln, pair hits with more than 10K bps distance between them and with associated values of average distance diameter (ADD) larger than the 75% percentile of ADD values. (D) Subset Lk+Ln+Tr, pair hits with more than 10K distance between them, with values of ADD larger than 75% percentile of sequence distance, and with values of transitivity smaller than the 25% percentile of the cluster coefficient. Pearson correlation coefficients, r, of actual vs. random (sample) enrichment factors are given for each analysis. Wr-values correspond to correlation coefficients weighted according to the number of pairs entering the correlation. For comparison, raw enrichment values as reported in (A) are repeated in all graphs (light blue bars).

