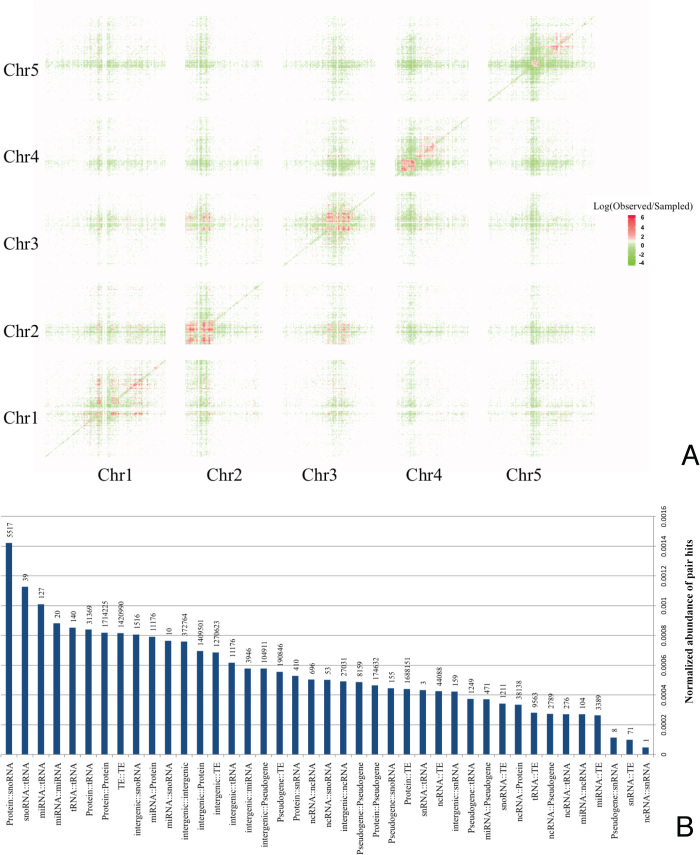
Figure 5.
Summary of pair hit results obtained for subset Lk+Ln+Tr. (A) Heatmap of the natural logarithm of the ratio of number of observed pairs in the filtered data and the number of randomly sampled pairs, counts per bins of 100K bp. To both, the numerator and the denominator, an arbitrary constant of 10 was added to avoid dividing by zero and to mitigate the noise due to small numbers. (B) Normalized abundance of pair hits representing the fraction of all significant SNP–SNP correlations carrying a particular type of genomic element class relative to all possible comparisons of any SNP–SNP site of this class. Numbers above the normalized frequency bars denote absolute counts of pair hits.

