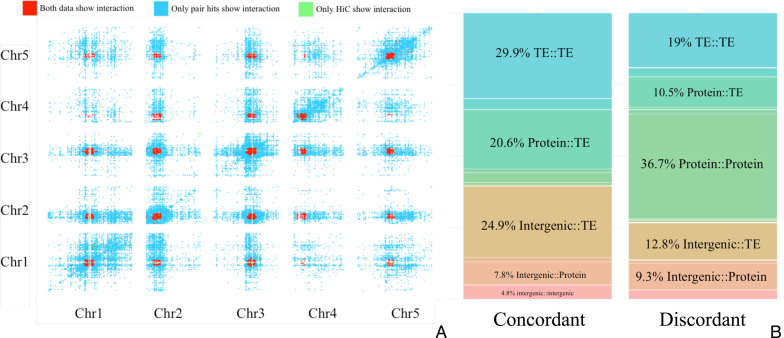
Figure 8.
(A) Heatmap of genomic regions considered interacting. Cells (pairwise bins of 100K bp) that have significantly more pair hits than randomly expected are considered correlated and colored blue. Cells (same bin size of 100K bp) considered physically interacting based on Hi-C data shown in green. Overlapping cells for both sets are colored red. (B) Percentage of pair hit annotation classes, counted in paired regions that appear to be chromatin interactions as well as enriched for correlated mutations (left panel, ‘concordant’) and counted in regions that are not chromatin interactions (right, ‘discordant’).

