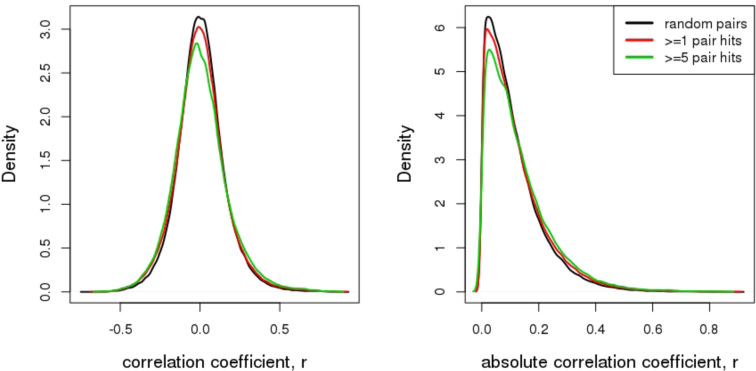
Figure 9.
Pairwise gene expression correlation of transcripts encoded by gene pairs linked via correlated mutations (pair hits) and as measured by raw (left) and absolute (right graph) Pearson correlation coefficient, r. Considered gene-pair sets were linked by at least one (294 479 gene pairs with available gene expression information for both genes) or five pair hits (56 718 pairs) and compared to a set of randomized pairings (172 443 gene pairs) of the same set of SNP-sites. All SNP-locations on genes were considered; i.e. also including non-CDS regions such as introns or UTR.

