Figure 1.
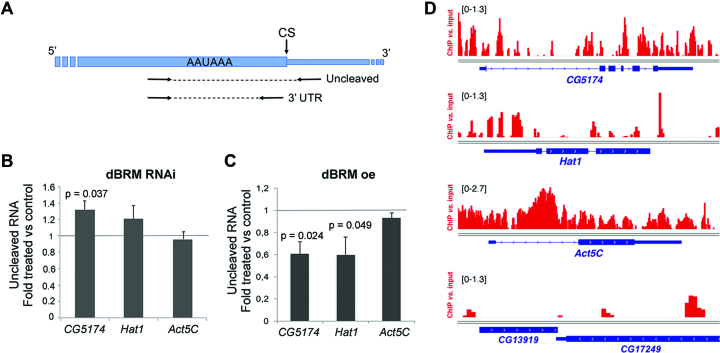
The cleavage of CG5174 and Hat1 pre-mRNAs is regulated by dBRM. (A) Drawing showing the position of the primers used for RT-qPCR in the cleavage assay. The thick box represents the 3′ UTR. The thin stretch represents genomic sequences downstream of the cleavage site (CS). The relative amount of uncleaved pre-mRNA was quantified using the uncleaved primers and normalized to the amount of 3′ UTR (using the 3′ UTR primers). (B) S2 cells were treated with dsRNA complementary to either dBRM or GFP (control) for 48 h. The relative levels of uncleaved pre-mRNAs were quantified by RT-qPCR, and normalized to the 3′ UTR levels of each transcript. The bars show the average ratio between dsBRM and dsGFP samples. The error bars are standard deviations from three biological replicates. (C) Stably transfected S2 cells were treated with 200 μM CuSO4 for 24 h to induce the expression of recombinant dBRM. The relative levels of uncleaved pre-mRNAs were quantified by RT-qPCR as in C. The error bars are standard deviations from three biological replicates. (D) dBRM occupancy in four selected genes visualized in the IGV browser. The Y-axis shows the enrichment of the ChIP signal relative to the input. The bracketed numbers on each panel show the y-axis values. CG13919 is shown as an example of a gene that is not occupied by dBRM. The dBRM ChIP-seq data was from Jordán-Pla et al. (7). In B and C, one sample t-tests were used for statistical testing. Significant probability (p) values are shown in the figure.

