Figure 2.
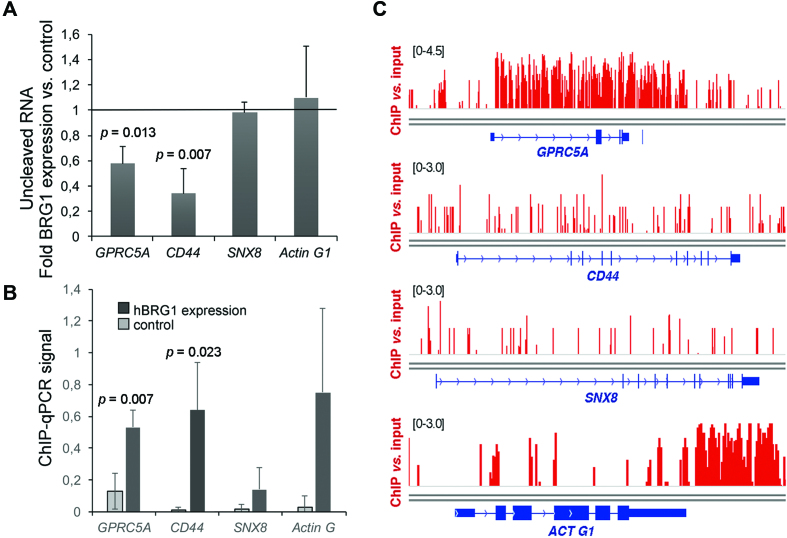
The cleavage of GPRC5A and CD44 pre-mRNAs is regulated by hBRG1. (A) C33A cells were transfected with a plasmid for the expression of hBRG1, and harvested 48 h after transfection. Cells transfected with the empty vector pOPRSVI were used as control. Relative levels of uncleaved pre-mRNAs were quantified by RT-qPCR and normalized to the 3′ UTR of each transcript. The figure shows the average ratio between overexpression and control samples. The error bars are standard deviations from four biological replicates. One sample t-test was used for statistical testing. Significant probability (p) values are shown in the figure. (B) ChIP-qPCR using an antibody against hBRG1 to analyze the presence of the protein at the CS of the analyzed genes. ChIP was performed in C33A cells expressing hBRG1 48 h after transfection. An IgG antibody was used in parallel as a negative control. ChIP results were quantified by qPCR using the ‘uncleaved primers’ shown in Figure 1A. ChIP signals are represented as percentage of input after subtracting IgG values from positive signals. The error bars are standard deviations from three biological replicates. Two sample, two-tailed t-test was used for statistical testing. Significant probability (p) values are shown in the figure. (C) hBRG1 occupancy in the genes analyzed in A and B, based on ChIP-seq data from Euskirchen et al. (5).

