Figure 3.
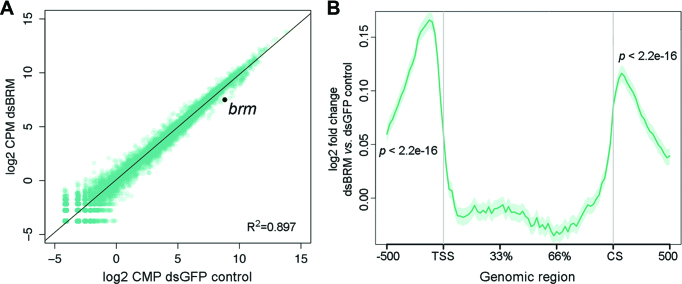
RNA-seq reveals genome-wide effects of dBRM depletion in gene flanking regions. S2 cells were treated with dsRNA complementary to dBRM for 48 h to deplete dBRM. Control cells were treated with dsGFP and analyzed in parallel. The transcriptomes of dBRM-depleted and control cells were analyzed by RNA-seq. (A) The scatter plot shows normalized RNA levels (expressed as log2 counts per million, CPM) in control cells (X-axis) and in dBRM-depleted cells (Y-axis). The Pearson's correlation coefficient is provided in the figure. (B) Metagene representation of the average effect of dBRM depletion on RNA levels in the gene bodies and flanking regions of all genes in S2 cells (n = 13924). The Y-axis shows log2 value of fold change in cells depleted of dBRM compared to control cells. The X-axis indicates genomic regions including the gene body, 0.5 kb upstream of the TSS and 0.5 kb downstream of the CS. A one-sample t-test was used for testing the statistical significance of the change in RNA levels observed in the 5′ and 3′ flanking regions.

