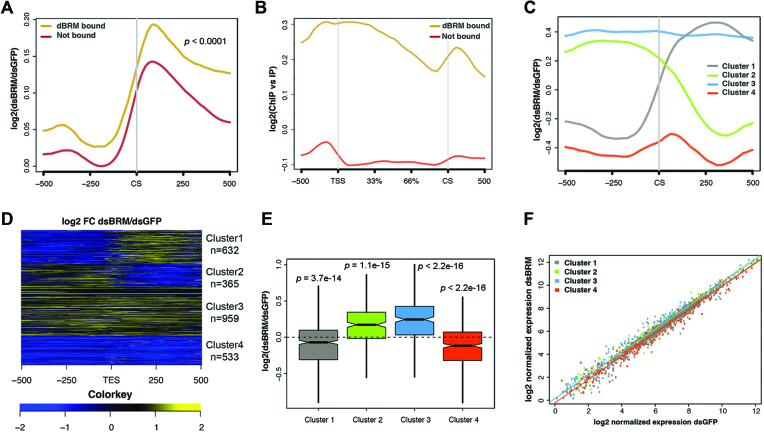
Figure 4.
RNA-seq reveals global effects of dBRM depletion on different subsets of genes in S2 cells. (A) Metagene representation of the effect of dBRM depletion on RNA levels 0.5 kb around the annotated CSs. The Y-axis shows log2 value of fold change in cells depleted of dBRM compared to control cells. Genomic regions upstream and downstream of CS are indicated on the X-axis. The plot shows an average increase of RNA reads downstream of the CS. The increase is more pronounced in the dBRM-bound genes (brown) than in the non-bound genes (red). Statistical testing of the difference between the two metagene distribution was done using the Kolmogorov-Smirnov test. The figure shows RNA reads from the sense strand only. (B) Metagene analysis of dBRM occupancy along the gene body and flanking sequences (X-axis). The Y-axis shows the log2 of the ChIP signal normalized to the input. The dBRM-bound genes are shown in brown (n = 2521 genes) and the non-bound genes in red (n = 11 403 genes). (C) Clustering of dBRM-bound genes according to the changes induced by dBRM-depletion on RNA levels in the CS region. (D) Heatmap showing the effect of dBRM depletion on the RNA level along each of the genes in the four clusters shown in B. (E) Boxplot showing the effects of dBRM depletion on the average expression of the genes in each of the four clusters. Statistical testing was done using a Wilcoxon test. (F) Scatter plot comparing the levels of expression of each gene in control cells (X-axis) and in cells depleted of dBRM (Y-axis).

