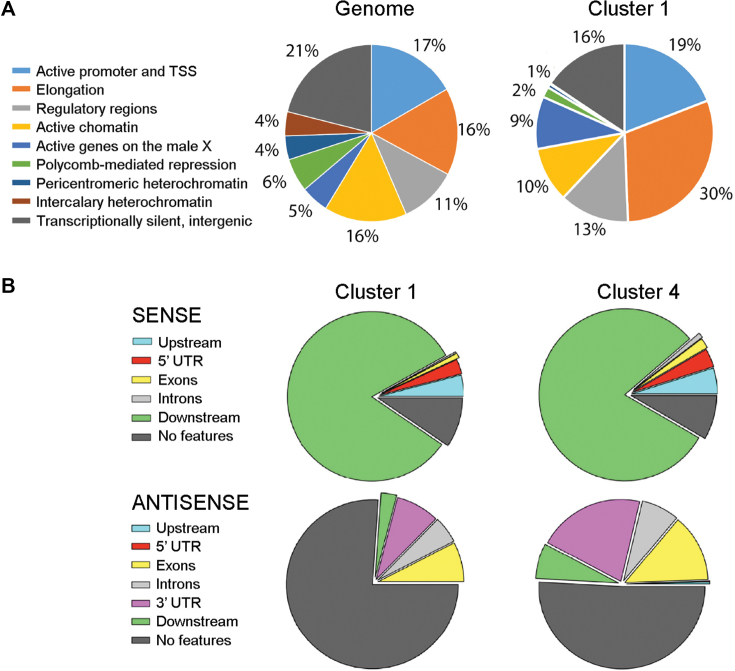
Figure 6.
The sequences downstream of the genes in cluster 1 are gene-poor and enriched in open chromatin features. (A) The sequences downstream of the CS were classified according to the 9-state chromatin model of Karchenko et al. (38). The pie diagrams show the occurrences of each type of chromatin state in the average of the S2 genome and in the genes of cluster 1. (B) The pie diagrams show the occurrences of annotated gene features in a window of 350 bp downstream of the CS of the genes in clusters 1 and 4. Features in the ‘sense’ direction refer to genes in tandem, whereas features in the ‘antisense’ direction reveal the presence of convergent transcription units. ‘No features’ denotes the absence of annotated gene features in the region of interest.

