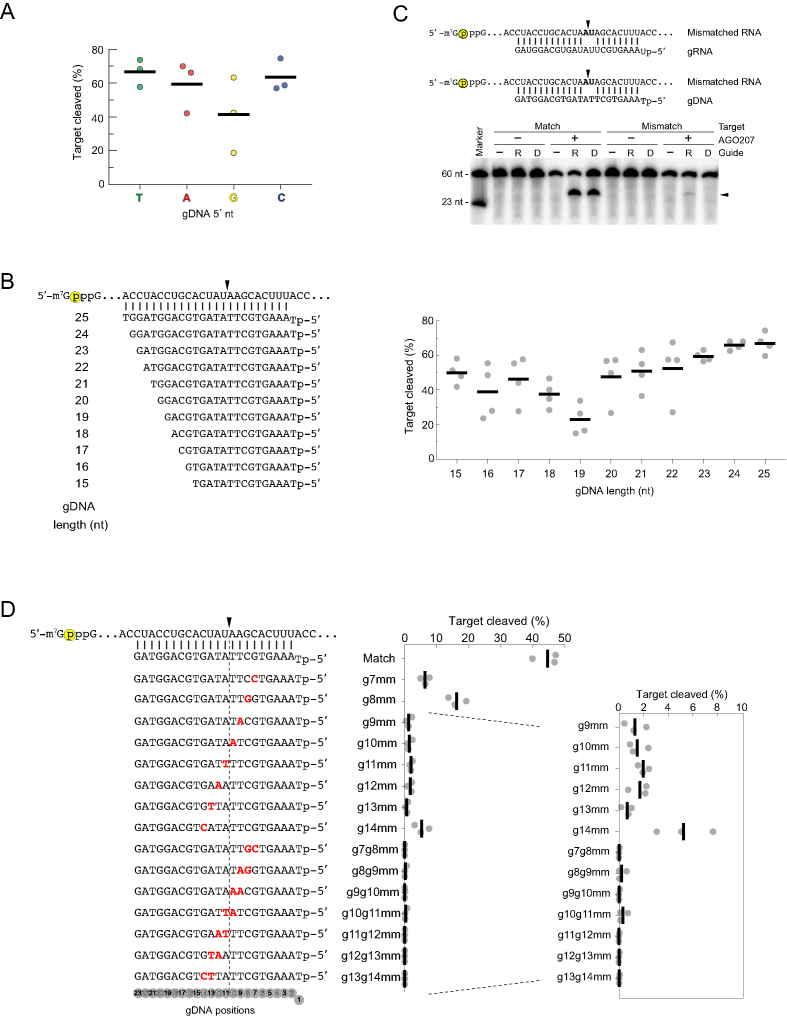
Figure 2.
Optimization of gDNAs. (A) Evaluating the effect of the 5′ nt on cleavage activity. AGO207 was programmed with gDNAs whose 5′ nt was T, A, G or C followed by addition of a cap-labeled RNA target that perfectly matches all guides from positions 2–23. Black bars indicate average cleavage of three independent replicates and dots indicate cleavage percentage of each individual replicate. (B) Optimizing gDNA length. (Left) miR-20a-derived gDNA sequences with 5′ T were varied in length from 15 – 25 nt. Yellow circle indicates cap-label. Black arrowheads indicate cleavage site. (Right) Quantification of cleavage products using gDNAs of different length. Black bars indicate average of three independent replicates and dots indicate cleavage percentage of each individual replicate. (C) Evaluating sequence-specificity of DISC. (Top) Sequences of gRNA or gDNA paired with a cap-labeled RNA target that contains a dinucleotide mismatch at a non-permissive site known to abrogate cleavage by yeast AGO. Yellow circle indicates cap-label on target strand. Black arrowheads indicate the cleavage site at t10 and t11 (positions 10 and 11 counting from the 5′ end of the guide). (Bottom) AGO207 was pre-incubated with either a gRNA or gDNA followed by addition of either a perfectly matched target or a mismatched target. Substrates and products were resolved by 16% denaturing PAGE. Black arrowhead indicates migration of cleavage product. (D) Single- and dinucleotide mismatch assay. (Left) Schematic of gDNAs (bottom) and target RNA (top) with mismatches in the guide shown in red and bold. Dotted line flanked by black arrowhead indicates cleavage site. Yellow circle indicates cap-label on target strand. (Right) Black bars on plot represent average cleavage by DISC of three independent replicates and gray dots represent individual replicates.

