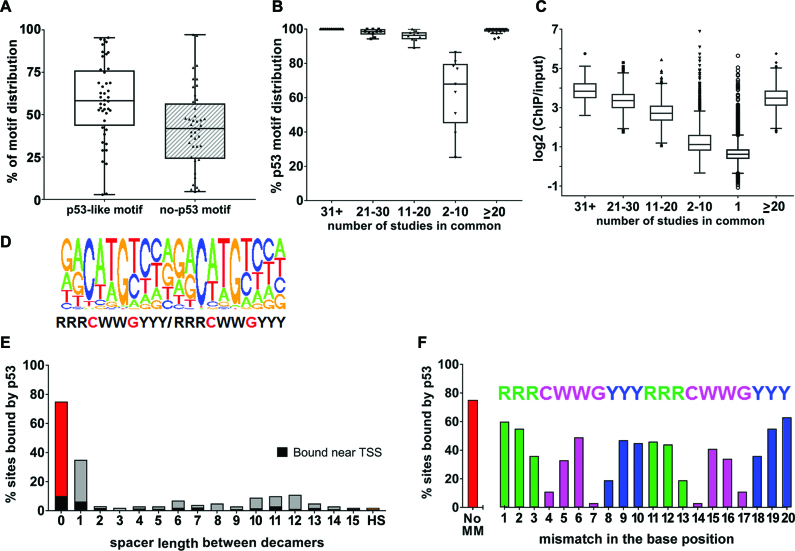
Figure 2.
p53 motif analysis. (A) Tukey boxplot of the peaks from the 44 activated p53 ChIP-seq data sets based on the type of sequence bound: p53-like motif (includes p53 consensus motif containing two decamers with no spacer sequence, with spacers of 1–15 bp between the decamers, or half-site/one decamer) or no motif (no evidence of a half site in the 200 bp peak). (B) Tukey boxplot of the percent of p53-like motifs in peaks that are frequently bound in multiple data sets as indicated. (C) Tukey boxplot of p53 ‘binding strength’ as measured by ChIP-over-Input fold enrichment of 54 947 peaks called in the data sets. Symbols beyond the whiskers are outliers. (D) de novo consensus motif identified from peaks in ≥2 data sets; (E) the % sites bound in vivo when there is a perfect motif with 0–15-spacer or just a half-site (HS); (F) the % sites bound when there is a perfect motif with 0-spacer with no mismatches (no MM) or with single mismatches at each position of the p53 motif positions.

