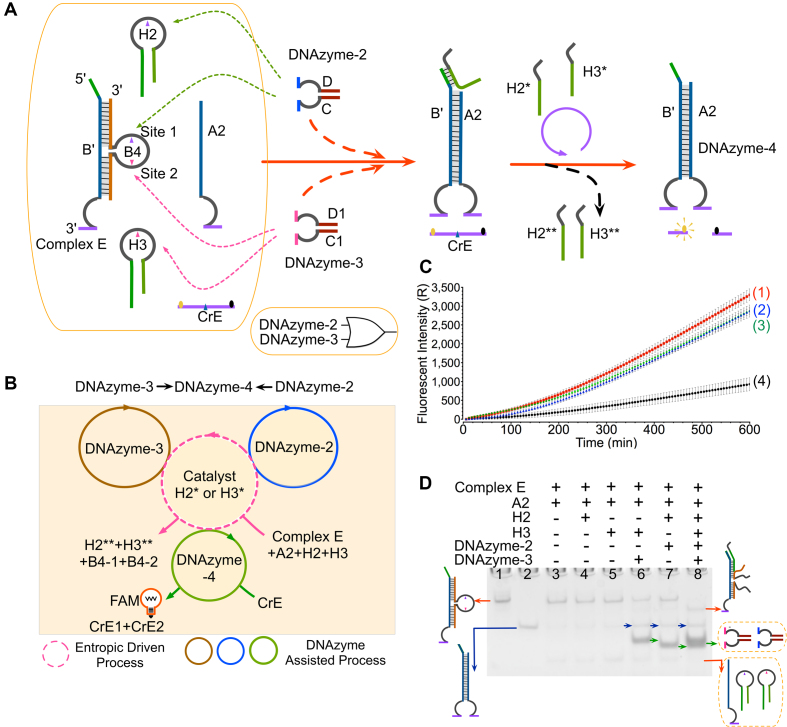
Figure 4.
Regulations of the OR gate using DNAzymes-2 and -3. (A) Schematic illustration of the logic gate. The loop region of strand B4 has two TrAGGs (purple arrow, loop site 1; pink arrow, loop site 2), which are similar to catalysts H2 (purple arrow) and H3 (pink arrow), respectively. The fluorophore FAM and quencher BHQ are functionalized at either end of strand CrE. DNAzyme-1 can cleave the reporter strand CrE to trigger fluorescent signals. (B) Abstract graph of three DNAzyme catalytic reactions (DNAzyme-3, -2 and -4) and one entropy-driven reaction (catalysts H2 or H3) in the OR gate. (C) Time-dependent fluorescence changes with different inputs. The time interval is 6 min. The curves (1), (2), (3) and (4) reflect the reactions with the addition of DNAzymes-2 and -3, DNAzyme-2, DNAzyme-3 and no input, respectively. All data represent the average of three replicates. Error bars represent one standard deviation from triplicate analyses. (D) Analysis of OR gate products using a 12% PAGE gel. ‘+’ denotes addition of the strand. Lanes 1, the products of the complex E; lane 2, the product of DNAzyme-4; lane 3, gate stands consisting of strand A2 and the duplex complex; lane 4, gate strands and one hairpin catalyst H2; lane 5, gate strands and one hairpin catalyst H3; lanes 6–8, in the presence of DNAzyme-3, DNAzyme-2 and both, respectively.

