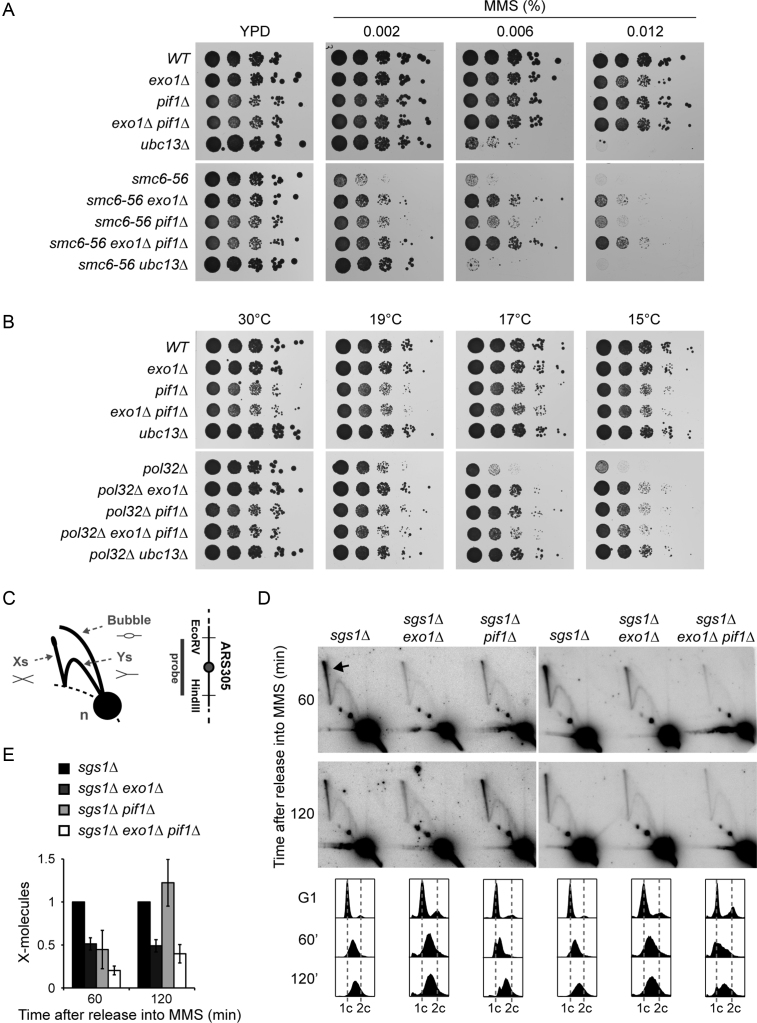
Figure 2.
PIF1 participates in TS. (A) Deletion of PIF1 suppresses the MMS sensitivity of smc6–56. Serial dilutions of relevant strains were spotted onto plates containing the indicated concentrations of MMS. (B) Deletion of PIF1 rescues the cold sensitivity of pol32Δ. Serial dilutions of relevant strains were spotted onto YPD plates and incubated at the indicated temperatures. (C) Schematic representation of DNA replication intermediates detected by 2D gel electrophoresis. X-shaped molecules represent recombination structures, Ys and bubbles are replication intermediates, and the n-spot represents non-replicating DNA. The 3.9 kbp EcoRV-HindIII fragment containing the early origin ARS305 analysed by 2D gel electrophoresis is shown on the right. (D) Deletion of PIF1 reduces the amount of X-shaped molecules in early S phase. 2D gel analysis of the ARS305 region was performed with the indicated strains. Cells were synchronized in G1 with α-factor, released in the presence of 0.033% MMS and samples were taken after 60 and 120 min. The arrow indicates X-shaped molecules. Cell cycle profiles are shown at the bottom. (E) Quantification of X-shaped molecules, relative to sgs1Δ and normalized to the n-spot. Error bars indicate SD derived from three independent experiments.

