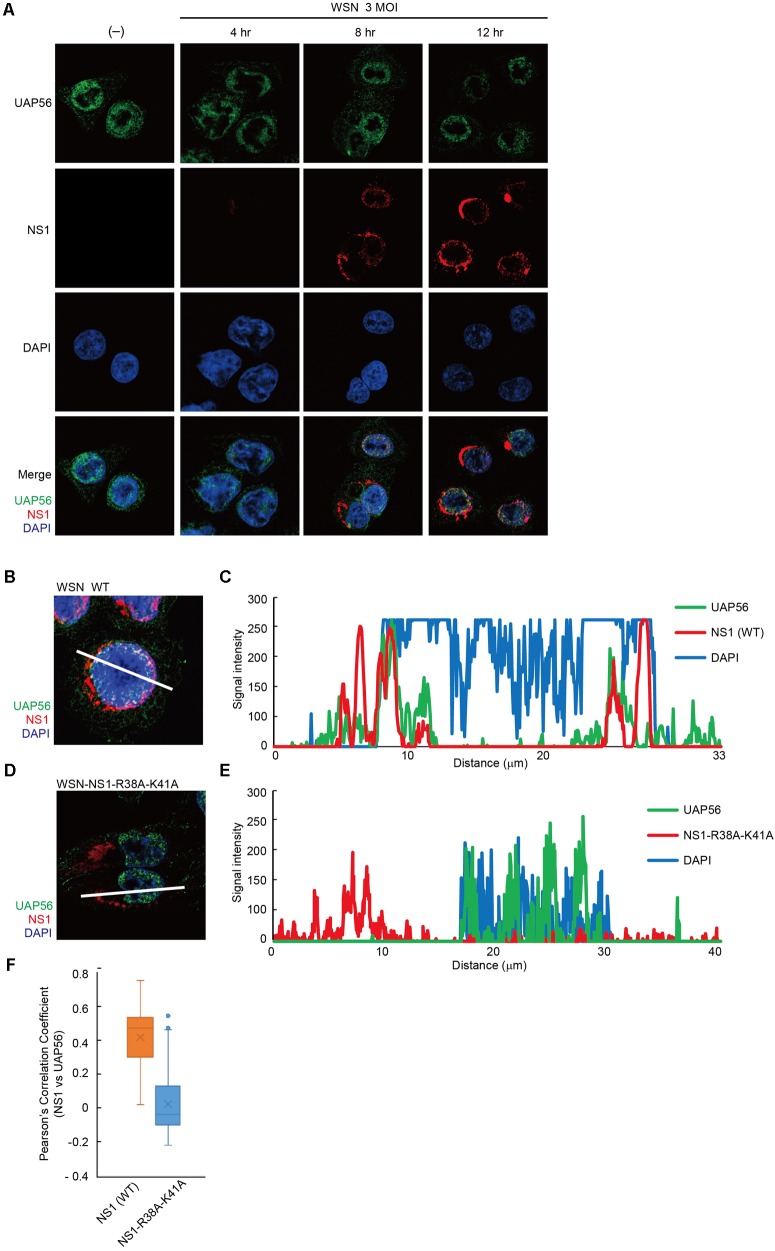
FIGURE 4.
Localization of UAP56 and NS1 in WSN-infected A549 cells. (A) A549 cells were infected with WSN virus at an MOI of three. At 4, 8, or 12 h post-infection, the cells were fixed with 4% paraformaldehyde in PBS. The cells were then analyzed with specific antibodies against UAP56 and NS1. (B–E) Representative immunofluorescence images of A549 cells at 12 h post-infection with wild-type (WT) WSN virus (B) or WSN-NS1-R38A-K41A mutant virus (D) at an MOI of 3. The cells were analyzed with anti-UAP56 (green) antibody, anti-NS1 (red) antibody, and DAPI (blue). (C,E) Signal intensities across the line shown in B,D, respectively, were plotted and analyzed by using LSM510 META and ZEN2009 software. (F) A549 cells infected with WSN WT virus (n = 102 cells) or WSN-NS1-R38A-K41A mutant virus (n = 100 cells) at an MOI of three for 12 h were imaged, and Pearson’s correlation coefficients for UAP56 and NS1 co-localization were determined for individual cells.

