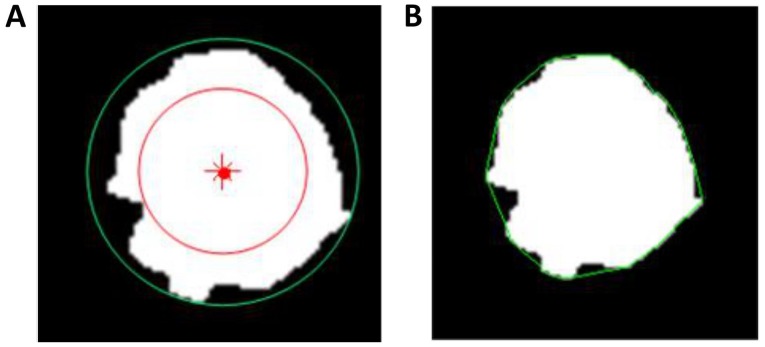
Figure 3.
Schematics of the (A) roundness and (B) concavity-rate calculations. In the roundness calculation, the red dot is the center of the lesion, and the red and green line circles are the inscribed circle and the circumcircle, respectively. In the concavity-rate calculation, the green circle is the convex hull.

