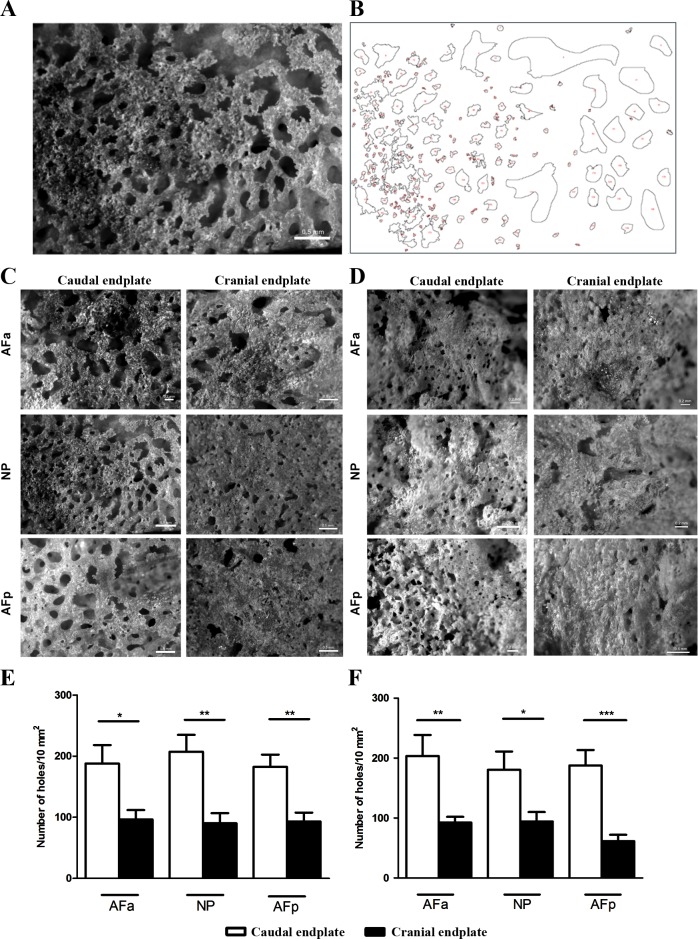
Fig 2. Endplate openings in the different regions of the disc per group.
In (A) an example of a scanning image from endplate openings and in (B) an example of a binary image of a nucleus pulposus region in the ImageJ software. (C) Middle-aged (younger than 50-years of age) and (D) Old-aged (older than 80-years of age). Observe that in caudal endplates there are more openings in all regions. Endplate openings per 10 mm2 in cranial and caudal endplates above and below the discs of Middle-aged (E) and Old-aged (F). Images acquired from a 10 mm2 area in the Stereo Microscope Discovery V.8. AFa–anterior annulus fibrosus; NP–nucleus pulposus; AFp–posterior annulus fibrosus. (*) p < 0.05; (**) p < 0.01; (***) p < 0.001. ANOVA-test, followed by Bonferroni post-test.

