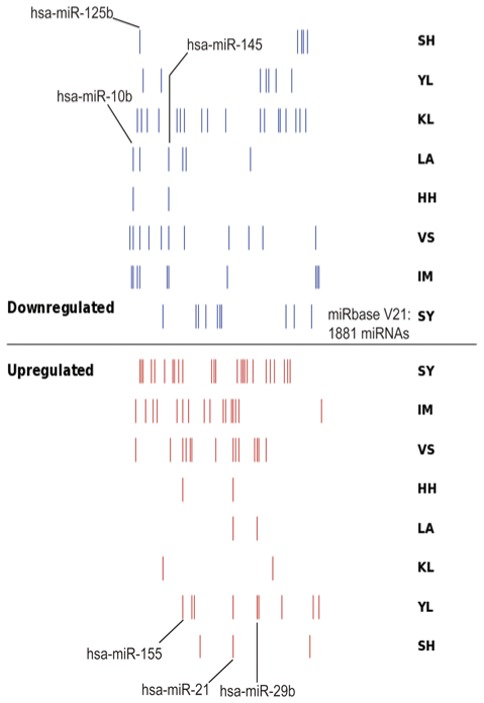
Figure 2.

Distribution of differentially expressed miRNAs in 8 datasets. The red lines represent the upregulated miRNAs in the datasets compared with the normal tissues, while the blue lines represent the downregulated miRNAs in the datasets compared with the normal tissue. The distribution pattern of this figure indicates that there are large differences in the numbers and distributions of differentially expressed miRNAs in different data sets. The 6 miRNAs labeled in the figure represent the identified meta-signature miRNAs in the present study, which were differentially expressed in at least three studies among all eight datasets. hsa, homo sapiens; miR/miRNA, microRNA.
