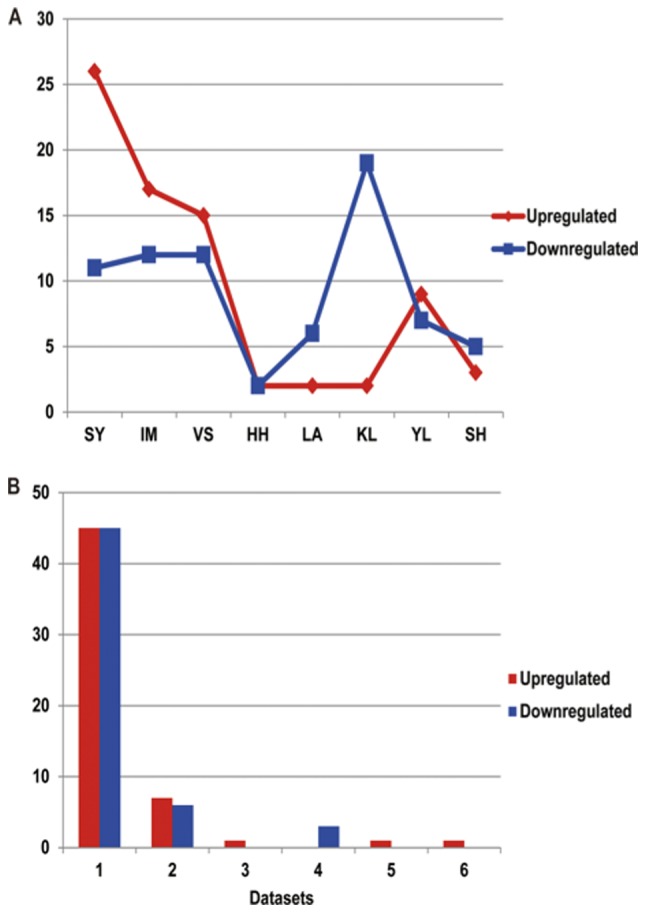
Figure 3.

Number of differentially expressed miRNAs, and the statistics of different differentially expressed miRNA supported by the 8 different breast cancer miRNAs datasets. (A) The difference between the number of upregulated miRNAs and downregulated miRNAs compared with the control groups. The x-axis represents the acronyms of the authors and the y-axis represents the number of miRNAs. The red lines represent the upregulated miRNAs in the datasets compared with in the normal tissues, while the blue lines represent the downregulated miRNAs in the datasets compared with in the normal tissues. (B) miRNAs identified by different datasets. The x-axis represents the number of datasets, and the y-axis represents the number of miRNAs. There are 3 upregulated and 3 downregulated cases of differential expressed miRNAs which were supported by the datasets. miRNAs, microRNAs.
