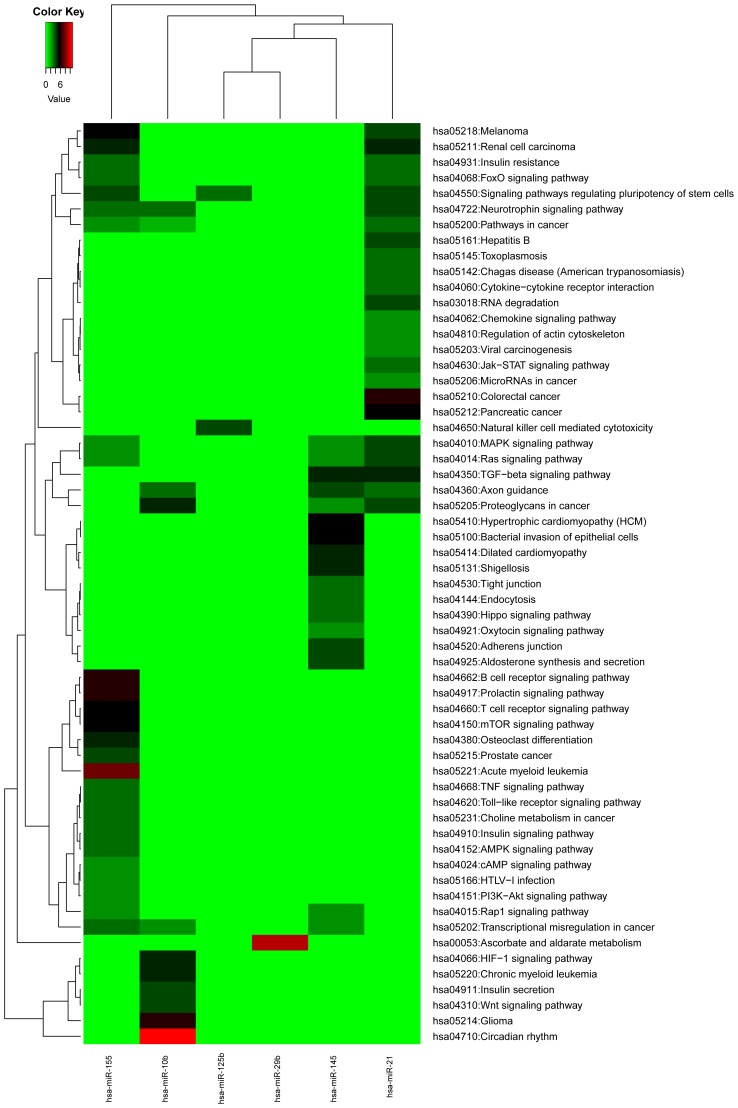
Figure 4.
Metabolic pathway enrichment results of target genes of meta-miRNAs. This figure shows the Kyoto Encyclopedia of Genes and Genomes pathway functional enrichment results were identified in all six differentially expressed miRNAs. The different colors represent the different levels of enrichment levels of the pathway terms in the miRNA target genes; the darker the color, the higher the degree of enrichment. hsa, homo sapiens; miR/miRNA, microRNA.

