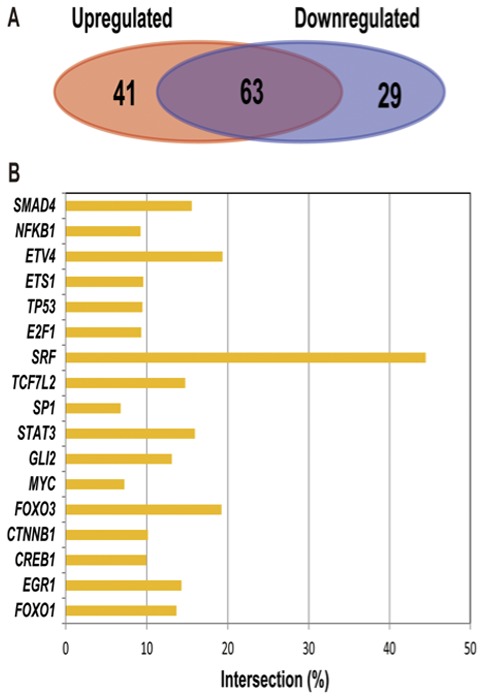
Figure 5.

Analysis of the transcription factors in the up- and downregulated miRNAs target genes. (A) Comparison of the shared and unique transcription factors in the up- and downregulated miRNAs. The red background represents the number of transcription factors that were upregulated in the target gene of the miRNA. The blue background represents the number of transcription factors that downregulate the target genes of the miRNA. (B) Cross-rate statistics for important transcription factor regulation associated with target genes of up- and downregulated miRNAs.
