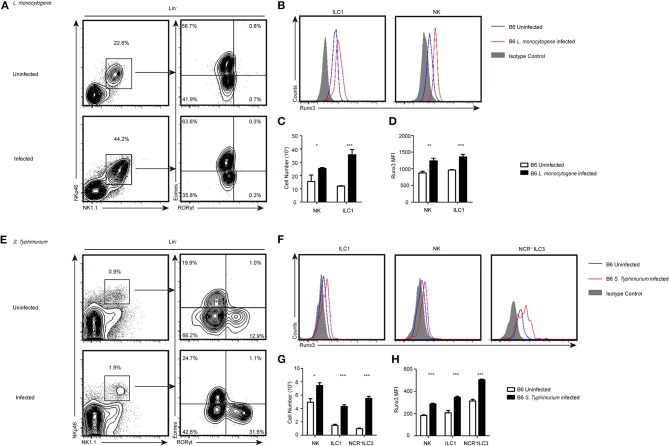
Figure 1.
Group 1 ILCs and NCR+ILC3s accumulated intracellularly in bacteria infected organs and upregulated the expression of Runx3. (A–D) B6 mice were infected with L. monocytogenes through tail vein injection as the infected group (n = 3) or injected with sterile PBS as the uninfected group (n = 3). (A) Flow cytometry assay of the percentage of ILC1s and NKs from the livers of both groups. ILC1s were stained Lin−NK1.1+NKp46+RORγt−Eomes− and NKs were Lin−NK1.1+NKp46+ RORγt−Eomes+. (B) The expression of Runx3 was analyzed by flow cytometry in ILC1s and NKs from the liver. The isotype controls are the shaded curves, uninfected groups are blue curves and infected groups are red curves. (C) Absolute number of total ILC1s or NKs from livers before and after infection. (D) Flow cytometry analysing the expression of Runx3 in the indicated cell types. (E–H) B6 mice were infected with S. typhimurium by gavage administration as the infected group (n = 3) or lavaged with sterile PBS as the uninfected group (n = 3). The isotype controls are shaded curves, uninfected groups are blue curves and infected groups are red curves. (E) Flow cytometry assay of the percentage of ILC1s, NKs and NCR+ILC3s in both groups. NCR+ILC3s were stained Lin−NK1.1+NKp46+RORγt+Eomes−. (F) The expression of Runx3 was analyzed by flow cytometry in ILC1s, NKs and NCR+ILC3s from the intestine. (G) Absolute number of total ILC1s, NKs or NCR+ILC3s from the intestines before and after infection. (H) The expression of Runx3 in ILC1s, NKs and NCR+ILC3s from the intestine (mean ± SD of three samples in (C,D,G,H); *P < 0.05, **P < 0.01 and ***P < 0.001 by Student's t-test). Data are from one experiment representative of three independent experiments with similar results in (A,E).

