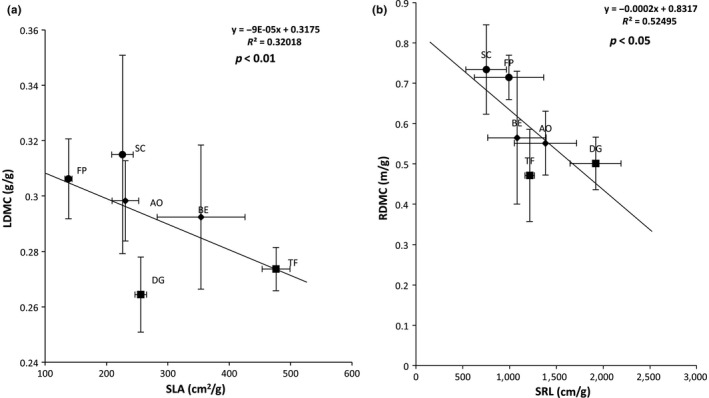
Figure 2.

Relationship between (a) LDMC and SLA, and (b) RDMC and SRL of six grass species representing a gradient of resource‐use strategies: Sesleria caerulea (SC); Festuca paniculata, (FP); Anthoxanthum odoratum (AO), Bromus erectus (BE); Trisetum flavescens (TF) and Dactylis glomerata (DG). Values and error bars represent the mean and standard errors of 4 replicates values, respectively. p values <0.05 represents significant correlation
