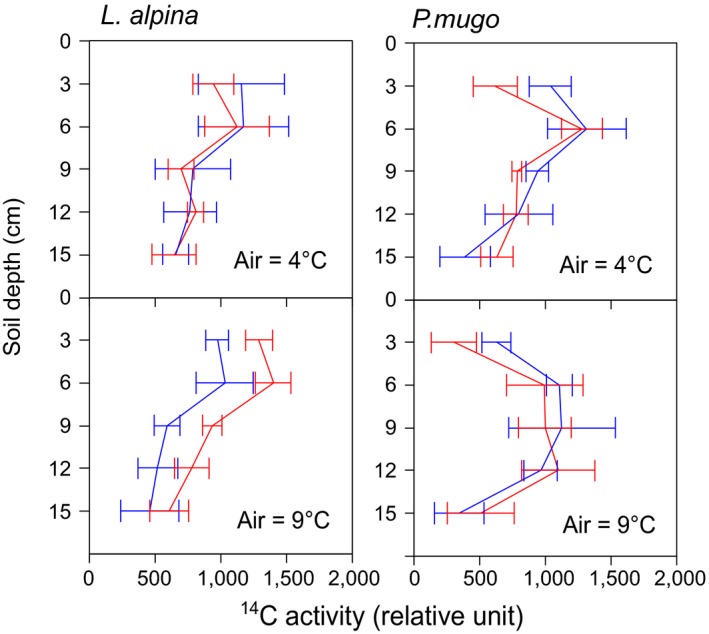
Figure 3.

14C distribution over the soil profile, determined by autoradiography (Supporting Information Figure S5 for image examples); data were averaged to 3 cm depth layers. Error bars are standard errors (n = 6 for L. alpina, n = 8 for P. mugo)

14C distribution over the soil profile, determined by autoradiography (Supporting Information Figure S5 for image examples); data were averaged to 3 cm depth layers. Error bars are standard errors (n = 6 for L. alpina, n = 8 for P. mugo)