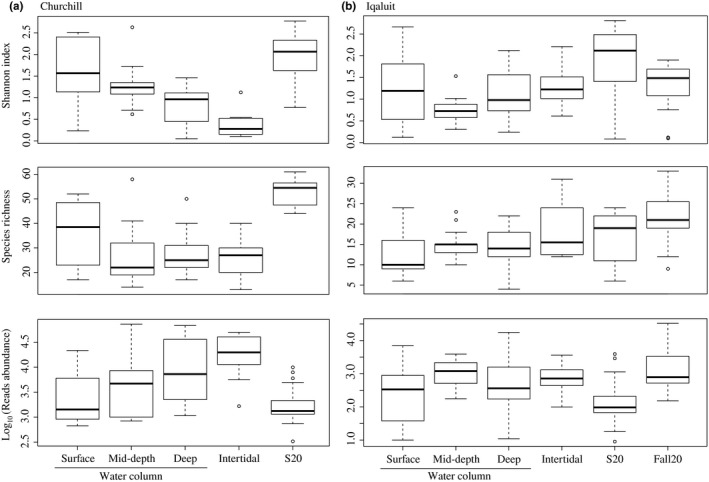
Figure 5.

Boxplots comparing Shannon indices, species richness, and read abundances detected using eDNA metabarcoding for each sampling location (i.e., water column (surface, mid‐depth and deep), tide pools and S20 and Fall20) in Churchill and Iqaluit. The lines inside the boxes represents the median values, the top and bottom of the boxes represent the 75% and 25% quartiles and outliers are shown using empty circles (i.e., any data beyond 1.5*IQR)
