
Figure 6.
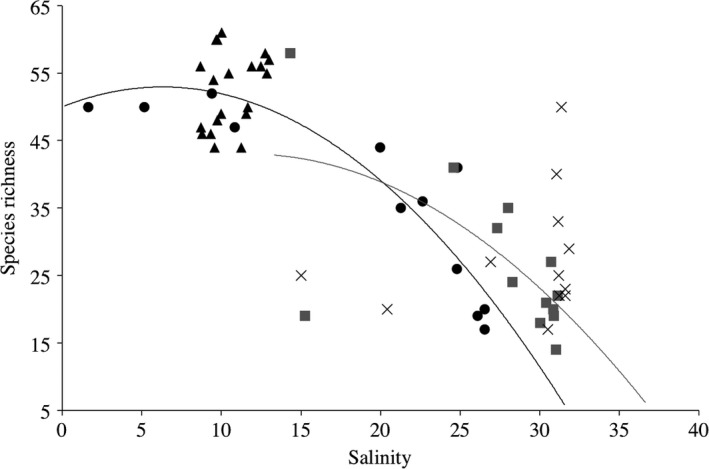
Relationship between the species richness detected using eDNA metabarcoding and the salinity of the water collected for the surface layer (R 2 = 0.85, black; circles: sampling water column and triangles: S20) and mid‐depth samples (R 2 = 0.44, gray squares) and deep water (gray cross)