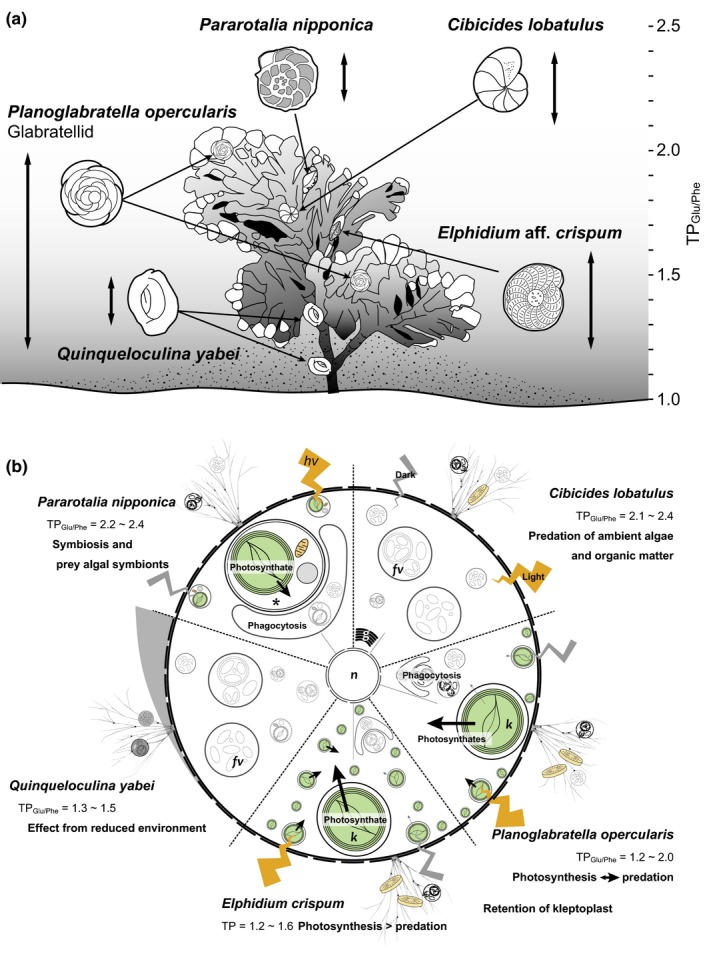
Figure 4.

Schematic illustration indicating diverse trophic ecology in each species (a) and estimated resource usage of each species (b). Arrows indicate the life position of each foraminiferal species (modified from Kitazato, 1988). Double‐headed arrows indicate ranges of TPG lu/Phe values (a). Arrows indicate putative route of photosynthates and indicate differences in resource use between light and dark conditions (b). *endobiotic algae; k, kleptoplast; fv, food vacuole; n, nucleus; and g, Golgi apparatus
